Production and operation
 Converting inputs into outputs is defined as producing or manufacturing. Handling products usually invoilves three units including marketing, financial acting and operating in which marketing supplys the demands of products, financial acting processes the value streams and operating add value to the final products. So 1-2% cost saving in operations can produce 5-20% increase in net profit according the statistics from American Business.
The ultimate competitiveness of product comes from the eternal excellence of operation and management.
01, Production systems and operations management
1.1, POM Value
On time in Full value added production, promised good quality with relaive low cost to keep the sustainable competitiveness .
1.2, Production systems and organization functions
Converting inputs into outputs is defined as producing or manufacturing. Handling products usually invoilves three units including marketing, financial acting and operating in which marketing supplys the demands of products, financial acting processes the value streams and operating add value to the final products. So 1-2% cost saving in operations can produce 5-20% increase in net profit according the statistics from American Business.
1.3, What is operations management
It is a discipline or practice to plan, design, act to achieve the goal of organization. The main goal of operations management is assure the sustainable profits, assure market needs of products to keep the unit existence and make unit growth. Effeciency, productivity and cost reduction is one side of effective weapon to assure the sustainable profits. The other side is to expand the market.
Every organization should have a strategy that refelects its mission and defines its organizational goals, policies, and performance measures precisely. The strategy should describe what general products the organization will produce, how it will compete most directly for customers, and how performance will be measured. It should identify where effort should be concentrated and what competitive advantages the organization will exploit. A well designed stratey should help the organization coordinate its organizational components and provides direction so that all actions contribute to the goals with marketing, financial and operating have their strategies respectively to support the general strategy that is usually decided by marketing.
Operations managers' responsibilities are designing and planning such as Product design, capacity planning, process design and choice of technologies, facility location, facility design and work organization and product quality assurance. The lower level work are operation and control including aggregate/intermediate-term planning, materials management and inventory control, Maintenance, scheduling personnel, equipment, jobs, distributions and logistics.
Operations management is concerned with the process of how to design, plan and operate production systems. Clearly, to be an effective operations manager, it is important to be sensitive to the physical and psychological characteristics of employees and to interact well with people on a personal basis. In addition, three other skills are important: (1) general knowledge of production processes, (2) knowledge and understanding of operations management principles, and (3) woking knowledge of decision making tools and techniques to help solve problems that occur in managing operations.
Many decision can be made using personal experience and simple decision rules. However, many tools and techiques were developed in past 60 years to solve the complex operational issues such as statistical process control, learning curves, scheduling heuristics(Scheduling jobs, designing facilities and designing production processes.), forecasting methods(Predicting prouct demands, materials and prices.), queueing analysis, optimization models or integer programming(Locating facilities, scheduling machines) and linear programming(Schedling production, personnel, fomulating products), decision analysis(Planning capacity, configuring and designing processes) and simulations(Designing facilities and processes, scheduling operations and managing inventories).
1.4, Operations management history
Production systems can be verified from the pyramids of Egypt and the great wall of China related to product design, facilities location, personnel scheduling and materials preparations. Until the 18th century, came the morden productions with very small scale.
Industrial revolution created modern operations management. The first major technological innovations appeared in the textile industry. Between 1733 and 1785 the invention of the flying shuttle, the spinning jenny, the water frame, the mule spinner, and the power loom revolutionized the industry. However, three other developments were necessary for the industrial revolution to become widespread: (1) invetion of the steam engine, (2) mass production of interchangeable parts, and (3) creation of machine tools to replace human labors in England and America. The industrial revolution was in full swing in Egland in 1825. Wages remained low, factories were drab and unhealthy, working days of 14-16 hours were common, and woman and children (many as young as 10 years old) were used almost exclusively as labor in several industries(Such as textiles).
The industrial revolution spread to the united states soon after the American Revolutionary War. Industrialization developed quickly in America for two reasons. First, the US economy was expanding because of the attraction of free land in the West. This created a constant shortage of labor, especially skilled craftsman. Second, there was a general openness to new ideas; the lack of an existing industrial base meant that there was no established way of doing things. Mechanization made it possible to produce more goods with less labor and less skilled labor. And because of mechanization, mass production of products needed more workers, materials, distibution of products, more specific or specialized labor and machines or tools which made modern operation managment possible.
Charles Babbage, a prominent mathematician and engineer who is best known today for designing the predecessor of the digital computer, called a difference engine was one of the first to propose using scientific methods to solve business problems and improve production processes. In 1832 Babbage wrote On the Economy of Machines and manufactures, in which he recommended the use of time study, wage incentive plans, research and development to improve products and processes, and economic analysis for selecting the location of facilities. But these recommendations went relatively unnoticed, and the study of operations management evolved slowly until the end of the 19th century.
During the second half of the 19th centry, scientific management appeared as influenced by natrual laws contributed by development of astronomy, chemistry, phisics and biology etc. which belived the production was led by production law. Taylor-father of engineering created the famous philosophy, use right (personality of people is different which needs operational managers to select proper person with related wage inscentive plan) people to do right thing on right time. And he also raised the concept of standard. Frank Gilbreth began his career as a bricklayer and laid five times more bricks than the average putting his philosophy " work smarter, not harder." Lillian Gilbreth are best known as the book and movie Cheaper by the dozen, which descibes how they used scientific management to raise their 12 children.
Some of the fruits of scientific management could be seen in 1913, when Henry Ford constructed the first moving assembly line which made it possible to use sub skilled workers, less assembly time (one auto assembly time decreased from 12.5 to 1.5 person hours) and the proce of autos plummeted and Model T Ford line can be considered the first Just In Time production system.
Social psychological effect study was done in 1927 at the Hawthorne plant of Western Electric Company now called Hawthorne Studies which ran for over 10 years using different group workers in different illumination room in which both of the groups displayed the improved productivities. The conclusion is that the workers in experiemnts considered themselves special and worked harder. Other experiments supported their results.
Walter Shewhart developed statistical control tools in the 1920s and 1930s. And during World War II the British government advocated research on military operations and US and Canadian governments created similar research.
After World War II the magnitude and complexity of organizations grew rapidly. Computers are now used to control and coordinate materials movements among several machines and to change tool settings for the machines continuously which are called flexible manufacturing system with the abbreviation of FMSs and Computer aided design (CAD) helps speed up product development, standardize the parts used in products, and make it easier to trasfer tool movement information to computer control equipment which is now known as information flow management system.
During 1970s, Japanese companies became significant players in the world economy, especially in products such as steel, automobiles, housewares, and computer electronics. During the 1980s, they came to dominate many industries.
A little known fact is that the majo components of the Japanese production system were introduced to Japan soon after World War II through a series of management training programs provided by US government: the Civil Communication Section (CCS) seminars, the Training Within Industry (TWI) courses, and the Management Training Program (MTP). These stuff was developed during World War II to help US companies gear up for the demands put on them during ther war but their influence diminished after the war. Japanese adopted and expanded such methodologies with 3 principles or goals: 1, Quality comes first. (a) designing products for better quality, (b) holding everyone responsible for product quality rather than using inspectors, (c) making the product correct the first time to avoid rework and rejects, and (d) utilizing statistical quality control methods where appropriate. 2, Imrove the product and process continuously. Most advances in process technology are the result of many small improvements overtime. Japanese production system encourages imrovements suggestions to reduce cost and increase quality. Japanese relys more on field workers to make suggestions but not experts. 3, Eliminate all forms of waste. Any activity or material that costs money but does not add value to the product is eliminated. This idea led to inventory reduction methods such as just in time production. Inventories usually do not add value to the product but cost money, so any reduction in inventories that soes not jeopardize on time delivery is beneficial. Similarly, quality defects are a form of waste and must be eliminated. This idea is the motivation behind the quality policy of making things right the first time.
The way Japanese companies such as Toyota implement these principles is as important as the principles themselves. First, there is total orgnizational commitment and involvement. Everyone is responsible for product quality, process improvement, and reduction of waste. These are not assigned to separate quality control or process engineering departments. Second, because they have greater responsibilities, workers require more education and training; Japanese comapnies devote considerable resources to training. Third, Japanese companies still utilize classical scietific management priciples of experimentation and measurement to see whether or not alternative methods are better. Industrial engineering is an integral component of most Japanese manufacturing companies.
In summary, the Japanese production system is based on US ideas that have been synthesized and improved by the Japanese.
An interesting aspect of operations management is that most of the vital problems a centry ago are still improtant today. The difference is that we have better tools and information to execute them. Of course, some new challenges face operations managers today such as environment issues. There are many opportunities for doing this, such as reducing production of harmful by-products, recycling waste materials and energies, and even scheduling employee work hours to reduce traffic and air pollution. Some are not only socially responsible but also economically beneficial.
1.5, Operations management, productivity and competitiveness
The ultimate survival of a company is to well market well manufactured good quality product in a proper cost. The ability to compete depends on how much value can be added to products relative to the cost of adding that value. During the 1960s and 1970s, productivity increased at higher rates in Japan and Western Europe than US who is now learning his lesson. For example, Motorola reduced its defect rate by over 99% in 5 years while generating annual cost saving of over $600 million. Overall, manufacturing productivity in US increased 3.5% annually in average from 1980 to 1990 compared to only 2.3% in the 1970s. Though was 16% from 1982 to 1993, the main reason was the exchange rate which contributed doubled exports of US in past 10 years. At the same time, per unit labor cost increased by 124% in Japan and 101% in Germany!
1.6, Operation management is for everyone
Operations management is the process and thinking but not limited in one person's profession which should be kept in every person's mind to guide the production.
02, Operations Strategy
2.1, Steering the ship
Without a set of long-term goals and a plan of achieving them, an organization is like a crew on a rudderless ship without a map or compass. Without a strategy, even good employees are unable to find the ways to achieve the company's goals. Operational decisions should be consistent with and promote the company's overall goals.
2.2, Organization's Strategy
It is important to recognize that there is no one best strategy for all firms. Companies within the same industry often have very different startegies, yet each may perform very well (or poorly). Sony and Hewlett-Packard have followed the strategy to being leaders in product innovation, while Matsushita and Texas Instruments have focused on process innovation, becoming low-cost, high-quality producers of large market products. It is important to have a clear strategy that utilizes the orgnizations' strenths and to execute it as planned. Steps in developing an organization strategy are 1, Establish organizational goals, 2, Analyze market characteristics, competition, competitive strenths and weakness, 3, Identify and select products, geographic markets, order-winning dimensions, 4, Specify policy constraints and guidelines.
A good strategy begins with an explicit statement of the organization's goals (called a mission statement) and the criteria to be used to evaluate their achievement. May have several goals but usually with one or two are dominant. For profit companies strive to maximize shareholder value. A closely related goal is to achieve a high (and growing) profit level over the long term to ensure survival. This might be measured by average annual growth in earnings over the last 5 years or by average return on equity over a similar period. A secondary goal might be to achieve security and stability. Nonprofit unit need explicit statements of goals even more than for-profit companies because their goals are often less apparent and may be more difficult to measure. For example, one university may establish its goal to be top3 universities in the world. It can be measured according to research patents or colleges rankings in related periodicals.
2.3, Operations as a competitive weapon
Historically, the organization strategies of most companies foucused on the marketing function. It is now recognized that operations or production function plays an essential role in achieving the organization's goals and should be integral part of the organization's strategy which should be proactive instead of reactive. The characteristics and competitive advantages of the operations function should influence which new products to make, which markets to serve, and especially along which dimensions the company can compete most effectively. Much of the success of Wal_Mart can be attributed to the fact that its founder, Sam Walton, was called "obsessed with operations."
The following examples show how operational strenths can be used effectively as competitive weapons.
a, Product/Process Expertise. For attracting more Chinese buying in Europe, more and more shops supply Chinese speaking waiters employees. One company may have experts carring on the R & D work.
b, Quick delivery. The competitiveness is decided by time. 360 Buy in China supply more quick delivery than amazon who earns more and more market share recently.
c, Short product cycle. The first product supplier gets the market first with huge margin. Hewlett-Packard has dominated the laser printer industry because it was the first in the market, and it has continued to bring out new products quickly before its competitors can catch up.
d, production flexibility. Build to order production system is modern chase with the successful example being DELL computer.
e, Low-cost process.
f, Convenience and location. Service to door is the ultimate competitiveness of modern service including manufacturing industry.
g, Product variety and facility size. Stores with enough varieties and easily payment systems attract customers more.
h, Quality. A company that can produce a product of higher quality can increase its sales volume. Toyota Motors and McDonald's are two examples of companies that have used quality as a competitive weapon. Low cost and high quality are their service goals.

Mission of operational improvement
Use man enough,--------Use availability, performance, time usage, improvement and sustainability to measure.
Use machine enough,--------Use Overall equipment effectiveness to measure affected by availability, performance and quality.
Use materials enough,--------Use materials usage to measure.
Use method enough--------Use productivity to measure the input and output being flexible and proper to produce specific product.
Use environment enough--------Use morale, turnover and safety accidents etc. to measure.
Use mesurement enough--------Use AQL to measure supported by accuracy and CPK etc..
03, Tours of operations
3.1, One Size does not fit all
One production process does not fit all products and companies. Each company has its own unique production processes in order to match its own set of products, desired output rates, and production locations though some similarities exist.
When the process or operation is implemented, the followings are needed to be considered,
1. What role do product quality, technology, and forecasting play?
2. What are the most possible operational issues, such as job desigh, inventory management, or schedling, that one company must resolve?
3. How does product mix and market size affect the structure and scale of process?
4. What are the differences between different process?
04, Forecasting
4.1 Good decisions begin with good forecasts
Consumer demand varies greatly from month to month and varieties go in and out of fashion quickly. There are techniques that can help us to predict what will be needed in the future such as product demand, transportation logics, facilities, capacities, materials, personnel hiring and personnel schedules etc.
4.2 Forcasting methods
It is very difficult to find a universal method that can forcast everything. Before choosing a general forecasting method, it is important to answer the following questions:
1, What is the purpose of the forcasts? For what decisions will they be used?
2, What lead time is necessary for the forecast to be of value?
3, What specific entity (variable) is to be forecast?
4, What do we know about the entity being forecast? what factors affect or are related to it?
5, What data or information about the entity are valuable?
The role of time
1. Short-term forecast usually look no more than 3 months ahead.
2. Intermediate-term forecast has a time frame of 3 months to 2 years.
3. Long-term forecast usually has a time frame of 3 to 5 years.
Quantitative versus qualitative methods
Quantitative forecasting methods use mathematical models to represent relationships among relevant variables based on historical data. Because of this method's preciseness, it sometimes referred to as objective forcasting methods.
In contract, qualitative methods rely on one or more individuals to generate forecasts without using mathematical models alone; for example, a sales manager may predict future sales for the division based on informal discussions with some customers. Qualitative forecasting incorporates the forecaster's experiences, intuition, values, and persoanl biases into the forecast. These are considered subjective forecasting methods because there is no way to determine exactly what information is being used by the forecaster and how. Such forcasts are specific to the forecaster and cannot be duplicated by others.
Although it may appear that quantitative one should be more consistent and accurate, in practice the results depend on the circumstances or relatively stable environment fulfilling short-term and intermediate-term forcasting. However, over longer time horizons or in unstable circumstances, such as when the possibility of a war, trade embargo, change of government, or major technological innovation exists, fundamental environment conditions and relationships may change. In these circumstances, qualitative one can often be superior to quantitative methods.
4.3, Qualitative forecasting methods
Quantitative methods require a substantial amount of reliable, consistent historical data or which affect variables same. However, in many circumstances these conditions are not satisfied, so qualitative methods should be used.In general, qualitative one is considered when one or more of the following conditions exist:
1, Little or no historical data. For example, forcasting the demand for a new product presents a problem.
2, The relevant environment is likely to be unstable during the forecast horizon. For example, the oil embargo of 1973, the integration of the European Union in 1992.
3, The forecast has a long time horizon, such as more than 3 to 5 years. Because technological innovation, competition, or government regulations may occur.
The primary drawback of using qualitative methods is that they rely primarily on the information gathering and processing capabilities of ther person making the forecast and cannot be independently duplicated. But this method can be improved over time by using the following methodological enhancements.
1. Standardize the process. For examples, what data should be used, how the data can be combined etc. Survey same customers, ask same questions.
2. Monitor forecasts. Most people are not very good forecasters unless they have received some training. One of the best ways to improve qualitative forecasting is to monitor the performance of the forecaster(s). Each time a forecast is made, it should be compared later with the actual outcome to determine its accuracy helping the forecaster to correct his bias.
3. Remove Incentives for accuracy. If sales manager's performance is based on his future sales quota, he may under forecast the sales in the future to assure he can sell more than the forecast to get the bonus.
4. Use group or panel such as group averaging, group consensus or Delphi Method.
4.4 Quantitative forecasting method
Analyze the relationship between independent (or predictor) variables and dependent variables.
1. Steps in modeling
1.1 Graph the relevant data
1.2 Select a general form of the function
1.3 Estimate the parameters of the function
1.4 Evaluate the model quality
1.5 Select and implement the best model.
2. Time series and causal models
Time series forecast the variables affected by time such as the products need in next year. Causal or associative models correlate dependent and independent variables such as the friction and force.
Time series usually include permanent component (P), trend component (T), seasonal component (S), Cyclic component (C) and random components (Sigmai)

4.5 constant process and the cumulative average
If there are different constant periods, moving average is often used to smoothe the fluctuation, weighted moving average, simple exponentional smmothing.
4.6 Quazi constant processes
4.7 Comparing alternative models
4.8 Linear trend processes
4.9 Seasonal processes
4.10 Causal models
4.11 Advanced models
05, Product Design and Operations
5.1, Product design revolution
The ultimate focus of every production system is the product it yields. In recent years, the business press has reported on dozens of companies, such as General Electric, Ford Xerox, Marriott, IBM, Taco Bell, Motorola, Hewlett-Packard, 3M, and Cincinnati Milacron, that have dramatically reduced their costs, improved their quality, and shortened their product development time, primarily by using new product design philosophies and techniques. In many cases, improvements in the product design process have reduced production costs by 20-40%, cut product development time by more than half, and improved quality by a factor of 10 or more. The common features underlying these improvements are greater attention during product design to how the product be made, concurrent design teams that include personnel from operations, engineering, marketing, and purchasing, as well as from customers and suppliers.
5.2, Product development
Product development begins with identification of a consumer need or desire and a way to satisfy it with a good or service. To understand this, we need to identify and evaluate the market. After we know the needs from customers, product can be developed and prototyped. Later, have a small production and ramp-up the product. If necessary, product modification and redesign also need to be carried out.
5.3, Product design process
Now the design has changed from over-the-wall approach to concurrent design or concurrent engineering (CE). The product is designed with considering not only the characteristics of it but also the production process to satisfy the quality, cost and practice. To acchieve expected result, a team from different departments should be setup. If possible, try to interact with customers and suppliers.
5.4, Basic principles of designing products for production
The overriding principle of product design is "Make it simple!".
06, Capability Planning and Facility Location
6.1 The importance of capability and location decision
Capability planning and facilities locating are important strategic decisions for any organization satisfying production, delivery and cost etc.
6.2 Measuring Capacity
Capacity is the rate at which output can be produced by an operating unit. It is expressed in terms of the number of units of output produced per unit time, such as the number of automobiles that can be assembled per year or the number of students who can be taught per semester. The design capacity is the maximum rate at which the process can operate on a continual basis under ideal conditions. In the short term, output rates above the design capacity can be achieved by incresing the speeds of machines, working overtime, or temporarily deferring maintenance though it is not cost effective usually due to machine wear and work fatigue. The effective capacity is the rate of production that can be achieved for extended periods under normal conditions, taking into account the product mix, maintenance, scheduling methods, employee training, and rest periods.
Capacity utilization=actual output/design capacity
Caacity efficiency=actual output/effective capacity
Overall equipment effectiveness (OEE) is a popular measurement of capacity utilization.
OEE=output time/solar time.
6.3 Capacity strategy
The primary purpose of capacity planning is to match the company's production capability with customer demand in the most profitable way. The capacity strategy should consider the facilities cost, but also the effects of capacity shortages and responsiveness. The seasonal products resulted capacity utilization loss can be reduced by producing similar but countercyclic products.
6.4 Capacity planning and evaluation methods
Forecasting demand and capacity requirements.
Dynamic capacity and experience effects.
Break-even analysis.
07, Selecting the Process Structure and Technology
7.1, More than one production process
When producing Yoghurt, we can let some people mixing the ingredients, some people sterilize the semi-products, some people ferment it and some people package it. And we can let one group of people do all of the Yoghurt producing activities from mixing the ingredients to package the fermented Yoghurt.
7.2, A common classification of prodution process structures
1. Flow Processes (More effecient). For example, when producing UHT milk, the materials flow from silo to pasteurization, and then to buffer tank and UHT, and then to filling machine.
2. Job-Shop processes(More flexible). For example, when building a truck, one shop builds the truck trunk, one shop builds the engine, one shop may build the driver cage and the other shop may combines all of the components together.
3. Cellular Processeses. It is made of flow processes and Job-shop processes together.
4. Project Processes. For example, to build a Airport or deploy an improvement project etc.
7.3, Modern technologies
Modern technologies make UHT milk possible. And we can also consider to use high speed or low speed machines according to the current situation.
Keep in mind that one whole production system may be made up of different subsystems.
08, Process Design and Facility Layout
Arrange the workers in working stations and finish the products within specific physical facilities is the topic here. Once general process structure and technology are selected, we need to arrange the resources to implement the prodcuing task. Efficiency is often an important factor to be considered.
09, Waiting or Queueing System
9.1, Queueing theory
One study found that during lifetime the average waiting time of one person is five years such as waiting in a bank, renewing a driver license etc. In a factory, the waiting is often called queueing.
10, Job design, Work methods, and Organization
10.1, People make the difference
The keys to the production system are the workers in the system. In thoery, all organizations have accesss to essentially the same standard equipment, materials, and facilities. It is an organization's personnel that provides the competitive advantage and makes one organization more successful than another. It is the people who create new and better products and devise better ways to make and distribute them.
Recruiting well-educated, responsible, and skilled people is a good starting point for creating a productive workforce. But, how employees are trained, organized, and motivated ultimately determines the success of the company.
10.2, Job design
A job can be defined as the set of tasks and responsibilities of a workers. These tasks and responsibilities, along with performance expectations, work conditions (time and place of work), general skills, and possibly methods to be used, are normally contained in a written job description.
A central aspect of job design is to define the tasks the employee is supposed to do-the job content. Simple job content such as folding boxes can be listed clearly. More complex job such as executive assistant or project manager, encompass a much wider range of tasks, many of which are performed infrequently, and some of the tasks cannot be described ahead of time. In fact, some jobs deal with solving problems that arise unexpectedly and are not secifically assined to anyone. In these cases, the job content has to be defined more in terms of general problem areas, skill areas, or responsibilities than in specific task descriptions.
Scientific management school just treats people as machine who is driven by money without considering their boredom and motivation advocated by Frederic Taylor. Their performance are improved by training and skills. Behavior (Psychological) school has shown that the quality and quantity of work performed are affected by psychological and organizational factors, such as how interesting the work is, how much control the worker has over the job, and how workers interact with coworkers. We must combine two schools to develop effecient work methods and exploit specialization of repetitive tasks while providing workers with variety, control over their work, and a satisfying work enviroment. The goal has been to reduce the layers of management, move decision making down to first-line workers, and utilize the capabilities of workers more fully, thereby making their jobs more interesting while increasing their contribution to the production process.
Job enlargement is a horizontal expansion of job tasks having a worker do several tasks at a work station rather than only one or two. In a bank, it might mean training a person to write home loans, car loans, and installment loans rather than only one of these.
Job enrichment involves vertical expansion of a job's responsibilities and skills to include the design of the product or production process, is responsible for her own quality testing, handles customer complaints etc. Some companies even sends assembly line workers to visit customers and dealers to advise them on using their products and to get advice on how to improve product quality. It is an integral component of so called Japanese or lean production systems and of total quality management to let the wokers be the real owner to contribute more.
Job Rotation can make the desirable and undesirable jobs are equally shared without being boring. Some rotates every 2 hours, but simply rotating among several undesirable jobs is not always beneficial.
An essential part of job rotation is cross-training of wokers. Some companies even eliminated the need for almost all supervision; there is only one supervisor for every 60 line workers.Operators are trained on several machines so that they can be moved around easily if one worker is sick, and they are trained in maintenance so that when a machine breaks down, they do not have to wait for a separate maintenance crew to repair it.
Although there is evidence that job enlargement, job enrichment, and job rotation improve productivity, product quality, and worker satisfaction, it is important to recoganize that some workers prefer specialized, low responsibility jobs, they simply work to earn a living. How or if these people should be incorporated into a production system remains an open question.
Traditional quality department work continues to be transferred to operators called TQM which is one job enrichment. One advantage people have over machine have over machines is their ability to perceive complex patters, learn from experience, and think. This ability makes workers a primary source of ideas for improving the production process. For example, Jerry McCoy, a worker at General motors, has had over 75 of his suggestions for improving GM's products and processes implemented. Periodical review, autonomous work teams, quality circles, suggestion boxes and so one are now the sources of improvement suggestions.
Automation sometimes is a good improvement of human-machine interface in which it may impede productivity addressed by GE vice president Gary Reiner. Only people can summarize the experiences to improve. Some company even removed installed expensive and complex devices to assure the flexibility and JIT in which simplicity is the goal of TQM.
10.3, Methods analysis and improvement
Specifying the tasks and responsibilities of a job is only the first step in the job design process. The next step is to determine how to perform the tasks, that is, determine the best work methods to use when performing the job. Included in the search for the best work methods are the most effecient physical movements of worker, the best sequence in which to perform movements or tasks, and the best way to coordinate the worker's actions with those of machines and other workers.
Identifying and implementing good work methods means doing the following:
1. Observing work and measuring its efficiency.
2. Analyzing existing work methods.
3. Applying good work methods principles.
4. Instituting and utilizing work aids and good ergonomic design.
5. Training employees.
An analytical approach to deciding what tasks should be done and how they should be done is method analysis which relys on data collection, visual aids and charts, and analytic procedures to help understand and improve work methods. The ultimate purpose is to simplify the process improving efficiency in which system and system analysis is the key using process flow diagram showing the step-by-step sewuence of the process and the corresponding movement of materials, people, or information and using process chart giving more detailed breakdown of the process into tasks which classifying each activity as being either a processing operation, movement, inspection, delay, or storage.
These documents can be used to perform a question-based analysis whereby, for each activity or movement, we ask the following questions:
1. What is being done and why? Could the task be eliminated, and what would happen if it were? Could it be combined with another task?
2. When in the process is the task being done? Must it be done at this time or is there flexibility in its sequencing or timing?
3. Where is the task done? Could it be done elsewhere, and would there be any benefit in doing it elsewhere?
4, How is the task done? Why is it done this way? Could it be done another way or automated? Are there changes in equipment, tools, or methods that make it easier to do?
5. Who does the task? Could someone else do it, especially as part of another job? Does the person doing it have the correct skills? Should it be done by someone of higher or lower skill?
It is a process improvement method. Process design focuses on product flow, and work analysis concentrates on the activities to be formed. In some cases, these analyses should be done together. Most methods analysis and job design focus on the individual worker and the tasks he or she performs. Frederick Taylor observes and study the most productive workers to get the best and simplest methods. Frank and Lillian Gilbreth analyzed each fundamental motion and action to identify the best way using filming, analying and timing the motions frame by frame called mico-mottion analysis.
The best basic movements can then be synthesized into an overall work method or procedure. This process is usually aided by using a Simo (Simultaneous motion) chart recording the movements and time of both hands separately. Worker machine chart and team-activity chart
When desin a job, some principles can imrove the result such as 1. coprocessing or parallel processing in which we can combine active phase such as cutting hair and passive phase such as weighing the packages when the filler is running. 2. Back-Hauling to avoid movements with empty hands. 3. Designing Human activities to be compatible with the human body to improve productivity and reduce fatigue. 4. Listen to workers to improve the job design continuously. 5. Work aids and ergonomics to configure the work area, design tools and use aids to reduce effort.6. Poka-Yoke: mistake-proofing such as use color band on the guage to display the abnormality. 7, Training especially in low production season which is an investment imroving productivity 50% and reducing materials costs 50%.
Four uses for standard time data and work standards:
Job design and work organization
Although the academic subjects of ‘organisational behaviour’ and ‘human resource management’ deal extensively with all issues concerning people in organisations, the design of people’s jobs is particularly important to operations managers. That is why we include this topic within the text (most other textbooks in this area also do the same). The important thing to understand about job design is that, more than any other subject in operations management, one can take very different perspectives on the task. For example, a traditional work study practitioner would look at job design in a very different way to an ergonomist or a specialist in team working. It is not that any of these perspectives are ‘wrong’ as such. Rather that they emphasise different aspects of job design. The reality of job design is that most of the perspectives presented in this chapter will have to be used. So, for example, it is not necessarily incompatible for an operations managers to use work study techniques to estimate how long each element of the job will take to perform, whilst at the same time considering the ergonomic aspects of how the working environment should be managed, and also deciding on the relevant level of autonomy to design into a work team. While there are very different principles implied in each of the approaches described in this chapter, they are not always incompatible. We have chosen to describe each approach to job design in chronological order. This is not because we are particularly interested in the history of job design, rather it is important to understand how one approach either built on the foundations of previous approaches, or, alternatively, reacted against previous assumptions.
Your learning objectives
This is what you should be able to do after reading Chapter 9 and working through this study guide.
- Identify the main decisions in job design.
- Describe how job design affects the performance objectives of the operation.
- Describe the main principles of each of the major influences on job design.
- Indicate how the different approaches to job design differ in terms of control and commitment.
The objectives of job design
There are clearly many alternative designs for any given job. For this reason, an understanding of what the job design is supposed to achieve is particularly important. As before, the five performance objectives give us a guide to what is relevant in job design decisions.
1. Quality
The ability of staff to produce high-quality products and services can be affected by job design. This includes avoiding errors in the short term, but also includes designing jobs which encourage staff to improve the job itself in such a way as to make errors less likely.
2. Speed
Sometimes speed of response is the dominant objective to be achieved in job design. For example, the way in which the jobs of emergency service personnel are organised (the range of tasks for which they are trained, the sequence of activities in their approved procedures, the autonomy which they have to decide on appropriate action, and so on) will go a long way to determine their ability to respond promptly to emergencies and perhaps save lives.
3. Dependability
Dependable supply of goods and services is usually influenced, in some way, by job design. For example, in the postal services’ working arrangements, multi-skilling, accurate use of sorting equipment through good staff-machine interface design, and the ‘design’ of postal staff’s clothing, can all aid dependable delivery of letters and parcels.
4. Flexibility
Job design can affect the ability of the operation to change the nature of its activities. New product or service flexibility, mix flexibility, volume flexibility and delivery flexibility are all dependent to some extent on job design. (See Chapter 2 for a full description of these different types of flexibility). For example, staff who have been trained in several tasks (multi-skilling) may find it easier to cope with a wide variety of models and new product or service introductions.
5. Cost
All the elements of job design described above will have an effect on the productivity, and therefore the cost, of the job. Productivity in this context means the ratio of output to labour input: for example, the number of customers served per hour or the number of products made per worker.
In addition, job design will influence two other particularly important objectives.
6. Health and safety
Whatever else a job design achieves, it must not endanger the well-being of the person who does the job, other staff of the operation, the customers who might be present in the operation, or those who use any products made by the operation.
7. Quality of working life
The design of any job should take into account its effect on job security, intrinsic interest, variety, opportunities for development, stress level and attitude of the person performing the job.
Division of labour
Although it is historically the earliest influence on job design, division of labour is arguably still the most important. If it were not all of us would do everything. The fact that we specialise is a tacit recognition of the advantages to be gained from division of labour. The main issue is the extent to which jobs are divided up. Although there are still some highly divided and very repetitive jobs, there has been a general trend in many jobs for division of labour to be reversed somewhat. But not totally eliminated, that is the important point, there is still some degree of specialisation in almost every job. The important objective is to balance the flexibility and increased job satisfaction which less divided jobs give most of us, against the degree of efficiency and learning which often goes with some degree of division of labour.
Scientific management
As far as scientific managements influence on job design goes, method study and work measurement are its twin legacies. Both are still practiced, though neither are as popular as once they were.
Method study has some advantages in its systematic approach to questioning why jobs are design in a particular way. Indeed, the conventional method study approach is very close to some more modern approaches such as business process reengineering. The main criticisms of method study (and indeed business process reengineering) centre around its limited objectives. It pays little attention to even the most obvious aspects of motivation. But the principles of method study are still valid for most jobs. For example, compare the way an experienced cook moves around the kitchen, automatically sequencing tasks so as to save effort or time or both. Compare that with the less experienced cook who does not have the innate ability to perform his or her tasks in an efficient or effective manner.
Work measurement is less widely used now. Time standards are still important of course. Any business still needs an estimate of how long jobs will take, if only for planning and control purposes. However, the use of time standards to underpin payment systems or control work rate is less common. Again though, it is still practiced in some operations. Supermarket check-out staff for example, or call centre operators generally work against time standards. And where they do, the practice can still be contentious. The boxed example on NUMMI on pages 272 and 273 is an interesting example of how some of the basic principles of work study have been used by staff rather than on staff. The idea of thinking about staff from a physiological point of view, but in a systematic manner, goes back at least half a century. As such it was once regarded as a little ‘old fashioned’ in job design circles. However, health and safety legislation in many countries has prompted a renewal of interest in the subject. So, for example, on automobile assembly lines the car is normally positioned at a height convenient for the assembly line staff to do their job without excessive bending or lifting. This not only eases strain on the assembly staff themselves but also helps to promote smoother, faster and higher quality working.
The way in which controls and displays are designed is also treated by ergonomists. The figure below demonstrates what ergonomists call the ‘person-work place loop’.
A much quoted but illustrative example of how the design of displays can affect the effectiveness with which the operator senses the information displayed by them is shown in the figure below. The seemingly obvious way of laying out a bank of dials would be toarrange them so that the zero mark is at the top. When switched on the dials are all likely to display different levels but often the ‘normal’ range is marked on the dial. However, detecting a dial which is displaying an ‘out of normal’ reading still takes some effort by the operator. Alternatively, the dials could be arranged so that their normal ranges are all pointing in the same way when the dials are switched on rather than off. Any deviation from the normal range then is very easily detected.
Behavioural approaches to job design
The title ‘behavioural’ approaches in clumsy but reasonably descriptive. This approach is the first so far to take the feelings and motivation of individual members of staff into account. Now the ideas of job rotation, job enlargement and job enrichment are well established in job design practice. Nevertheless it is important to understand that this approach still keeps the responsibility for designing jobs with operations management (or personnel management, or human resource management, etc.). It does not pass any responsibility or power to the people doing the jobs. In that sense it is not fundamentally different from earlier approaches to job design. Its motivation and objectives may be different but its practice is still very ‘top-down’.
Empowerment
The idea of empowerment, for the first time gives some responsibility for job design to the individuals who will perform the job. But, as the chapter discusses, the extent of autonomy can vary significantly. At its most limited autonomy can merely involve asking staff for their suggestions as to how jobs should be designed. At its maximum, only the broadest and most general of objectives are set by higher management and the whole nature of the job and its organisation is left to those who perform it. In between these two extremes there are any number of levels. In that sense ‘empowerment’ can mean almost anything. What many companies discovered is that empowerment ‘did not relieve them of the task of job design’. It has been found to be very important to be clear in drawing the boundary between those aspects of the job which staff can directly control and those which management still reserve the right to define. So, for example, an operation might draw up a list of issues which it reserves the right to impose such as types of behaviour which are not acceptable (racist, sexist, etc.), safety practices (compulsory wearing of protective headgear etc.), timing (when the process must start and when shift changeovers occur, etc.), and so on. However, it may also define a list of specific job issues which staff can decide for themselves, sequencing of activities, scheduling of activities, appropriate work methods, and so on.
Team-working and job design
The significance of this influence on job design is that the ‘unit of analysis’ of job designchanged. So, rather than automatically assume that job design involved defining the content of a job for each individual, a further variable was introduced – the team. A team is a group of individuals who, together, have a set of tasks to perform. From the point of view of the staff who form the team there may be a number of advantages in working on a team basis rather than an individual basis. The interest, motivation and fun which can be gained from working closely with colleagues can make any job more attractive. From the operations point of view several people working together can be not only more efficient and more flexible but also more creative in the way they seek solutions to continually improve their part of the operation.
Flexible working
Three types of flexible working are described in the chapter,
-
- skills flexibility
- time flexibility
- location flexibility.
In some ways this sequence of different types of flexibility is in order of difficulty. Skills flexibility involves individuals being able to do more than one job. This allows the operation to be more responsive as markets or other conditions change and also (arguably) makes jobs more interesting. It is not always easy to achieve skills flexibility, but at least most people are together in the operation at more or less the same time. Time flexibility, on the other hand, can present more difficulties because (by definition) not everyone will necessarily be together at the same time. Location flexibility can present even more problems, especially if individual members of staff rarely, if ever, meet up.
What percentage of time within a shift do you feel it is necessary for a supervisor should be on production floor?
Randy White • Johnathan, I encourage my Supervisors to be on the floor 80% of the time. Reviewing product, interacting with the employees to improve morale. Listening, talking discussing factors that can improve the quality of work and ergonomics. Basically get your ass in the grass.Shop floor presence let's the employees know that you care and your willing to work with them.
Magia Matang • depends on your organisational structure you can spend more or less time but id say 25% would be minimum one must spend on the floor to lead by example and promptly making decisions .
Adewale Yusuf • It does not matter the number of times. The most important thing, as a leader, is to build and have a team that is independent. Whether the supervisor or team leader is on ground or not, the team must be able to perform its functions effectively.
By this, I do not mean the leader should lazy about or be seen not carrying out his functions.
Warren Maruca • The shift, team or front line leader's job is on the production floor. A crew needs direction, supervision, guidance and a watchful eye of what is going on. The only way a an effective leader can do all of these things is to be out there and accessible.
Jozsef Czirjek I think 70% of his time from a shift he should be on the shop floor.
Jean-François Nicole • I think that most of is time should be on the floor, unless he have some other goal to meet, like C.I., 5S or kaisen to work on, but even in that case I think the supervisor should be replace during those periods of time. I think that the real question is how much time should you leave your production without any support? Or, how much time can my production run at a high effiency without any support?
fatoyinbo oladimeji • i think it depend on the team age, for a fresh team or workers i will agreed with 80-90 percent monitoring, but once the team is matured enough, i dont expect the supervisor to be with the rest of his guys always, or else they may not be independent on their own and this will create a problem for the supervisor any day he could not make it to work.
he should give them chance to prove themselve , while he stood by watching them.
11, The Quality management system
11.1 Quality philosophy
Companies perceived as producing products of poor quality have either failed or are struggling for survival, while those recognized for quality have generally flourished. During 1970s and 1980s, product defect rate of Japanese was 10-100 times lower than his competitors. Now US and Europe have eliminated this gap with the quality level increasing from 3 sigma (AQL is 3/1000) to 6 sigma (AQL is 2 per million) in electron industry. The consumers who buy products with good quality are more loyal than those who buy based on price and always change to competitors' products with lower price. We can also find that producers with good quality have lower cost because of using advanced management method to avoid quality loss caused cost. The approaches of Deming, Juran, Shingo and others actually support each other producing total quality management (TQM) which deploys quality management in all crossed departments but not only quality department, in every area of process but not the end products and by every personnel but not only quality people.
11.2 What is quality
Quality is the competence of product or service to satisfy the customer's need or expectation. In other words, quality is customer oriented with promising something to consumer. Specific quality dimensions varies in different products with the general references as the followings.
1, Performance. Performance is specificication promisiing to and recognized by customer such as density, viscosity and volume etc.
2, Features. Such as attracting desining of the packing, high resolution screen of cell phone etc.
3, Reliability and durability. Reliability is the quality consistency under normal maintenance, production and consuming environment such as in normal living environment, one type of TV can always displays the expected pictures. And durability measures the product life etc.
4, Maintainability and serviceability. Maintainability measures whether one product such as milk filler can be mainatined to keep its quality and serviceability measures whether there is after sales service such as on-site support or remote telephone hot line assistant support.
5, Sensory charicteristics. Products with high nutrition without being tasty or good smell are generally not good quality products.
6, Ethical profile and image. Different people have different believing affecting their judge or acception of some specific products.
11.3 Quality cost audit
We need to know wether it is worth to produce one specific level of quality. In other words, we need to find the equivalent point of quality input and output. Generally, we need to consider failure cost, inspection cost and prevention cost such as quality control. Traditionally, the cost distribution of failure, inpection and prevention are 50-80%, 15-40% and 5-10%. After TQM, the cost distribution of failure, inpection and prevention are 20-50%, 15-40% and 25-50%.
Quality Management Doctor
 Companies perceived as producing products of poor quality have either failed or are struggling for survival, while those recognized for quality have generally flourished. The consumers who buy products with good quality are more loyal than those who buy based on price and always change to competitors' products with lower price. We can also find that producers with good quality have lower cost because of using advanced management method to avoid quality loss caused cost. The approaches of Deming, Juran, Shingo and others actually support each other producing total quality management (TQM) which deploys quality management in all crossed departments but not only quality department, in every area of process but not the end products and by every personnel but not only quality people.
Aseptic production of milk and juice
The intention of this book is to present some of the knowledgeacquired during many years of practical work on the qualitycontrol and quality assurance of long-life products. Differentfactors have an impact on product quality – the standard of the rawmaterials, the equipment involved, the processes applied, opera-tional procedures, installation, and so on. In order to produce ahigh quality product, a thorough understanding of these factors isnecessary. An attempt has been made to discuss and present thematerial in a comprehensible way concentrating on microbio-logical aspects. The HACCP (QACP) concept has been used as amodel for process control.UHT-treated and aseptically packaged products have beenproduced in large quantities for quite some time. So far, the litera-ture available concentrates on particular aspects of product andequipment characteristics and the technology involved. A moregeneral presentation appears to be lacking. Hopefully, our workwill help close the gap.To a large extent, the available “old” literature has beenconsulted. The new literature is readily accessible through dataprofile searches. In addition, more than 25 years of practical fieldexperience has gone into this study.The different topics are arranged in such a way that each chap-ter stands as an independent entity. Of necessity, this has led tosome repetitions. We hope that the reader will accept the problemand make allowances for the consequences. It is also our hope thatthis study will contribute to the production of long-life productswith a high level of quality.Finally, we would like to express our appreciation to all theTetra Pak people who have helped to prepare this book and whohave contributed with valuable comments on the contents. Thisapplies particularly to Gösta Odelberg B. Sc., Regional ManagerFiSQA (Field Service Quality Assurance) and Dr. Charles Sizer.Åkarp, August 1998
Dr. Bernhard von Bockelmann Dr. Irene von Bockelmann

You can use cash or points to buy this book at points store or related display area. English version and name is Quality management of aseptic production, Chinese version and name is 无菌生产质量管理.
00.Introduction
Commercially sterile products have been on the market for a long time. Direct
UHT (Ultra High Temperature) processing was introduced at the beginning ofthe 20th century. At that time, the technology was used only as a pre-treatmentfor products to be filled into cans for subsequent retorting. The first UHT-treatedand aseptically packaged products were in cans and were shown at an agricultural exhibition in London in the mid 1920s. The product (milk) was not a commercial success. During the early 1930s, aseptic canning was developed in the USA (69).
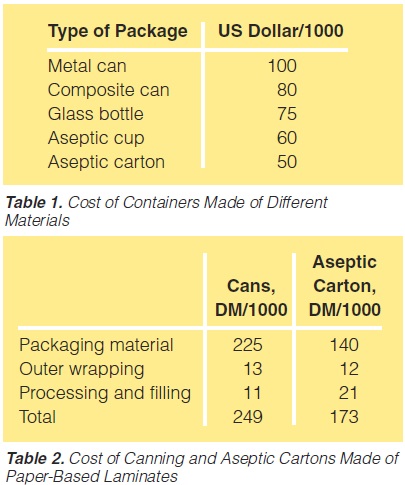
In 1961, aseptic packaging procedures were introduced (74, 93, 243) using flexible packaging material (a laminate of wax, paper and polyethylene): theTetra Pak system (“Tetra Classic Aseptic” or TCA system). The paperboardcarton and black colouring provided protection against the entry of light. How-ever, gas barrier characteristics were rather poor. In the meantime, UHT process-ing systems were in more general use. After initial problems, the combination ofUHT processing and aseptic packaging in the TCA system gained market success(“long-life products”).
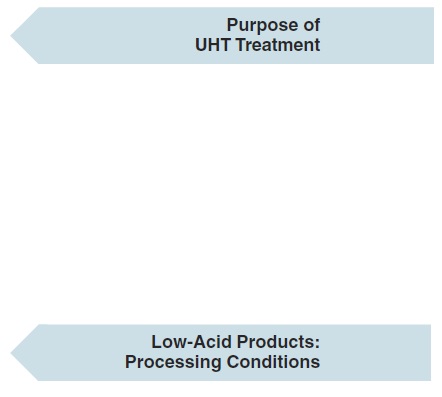
In 1969, a brick-shaped package was introduced (“Tetra Brik Aseptic” or TBAsystem). The structure of the packaging material was more complex: a poly-ethylene-paper-polyethylene-aluminium foil-polyethylene laminate. Such amaterial provides protection against the entry of light and acts as an effective gasbarrier. The shape of the container offered considerable advantages in storage,transportation and handling. It also provided the real break through for UHTprocessing and aseptic packaging technology. Today, larger quantities of both low and high-acid, shelf-stable food products are processed by inflow (UHT)methods and subsequently packaged under aseptic conditions. Milk andmilk-based products were the first long-life food products and still remain thelargest commodity in terms of volume.
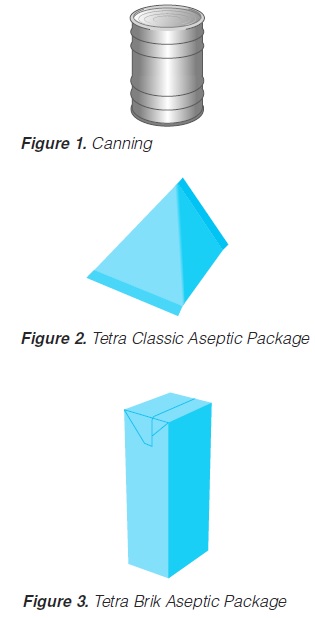
Processes that stabilise food thermally have been a major benefit to mankindby providing stability and safety in food. Although commercial canning isprobably the most reliable and safest method of food preservation, it is not perfect. In trying to improve the technology, the present low risk of contamina-tion present in simple straight forward technologies must sometimes be sacrificed to gain better quality and economy.
Aseptic technology is considered to have the followingadvantages over conventional technologies (254):
a)new package forms;
b)savings in energy and packaging costs;
c)convenience; and
d)improved product quality.
A comparison of the price of different packaging alternativesis shown in table 1 (278).In table 2, the total cost of canning is compared to theproduction of a long-life food product (table 2, 179).

01.UHT processing
Summary
Food products are processed by UTH Methods in order to obtain a commercially sterile product. Rapid heating, short holding and rapid cooling minimise the occurrence of chemical change. A short description is given of the principles involved in indirect and direct heating systems.
011.General description
1. General
Ultra-high-temperature treatment is a continuous inflow
process. It is based on the rapid heating of the product to the sterilisation temperature and short holding at that temperature, followed by rapid cooling. The purpose of UHT treatment is to achieve commercial sterility of the product. Full sterilisation efficiency requires rapid heat transfer which is only possible in liquid systems. If powders are used in the formulation of a product to be UHT-treated, special attention has to be paid to proper soaking: all powder particles must be completely wetted through.
1.1 Low-Acid, Liquid-Food Products
Low-acid food products are characterised by a pH value of > 4.5 or > 4.6, depending on local food legislation. These products require careful treatment because:
a) microorganisms can grow and multiply. Bacterial spores are also able to germinate and cause product spoilage;
b) practically all pathogenic (disease-causing) microorganisms can develop.
Consumption of products thus spoiled may lead to food poisoning and/or food-borne infections.
Typical processing temperatures for low-acid foods are 130-150°C with holding times of a few seconds (60), usually 4 seconds.
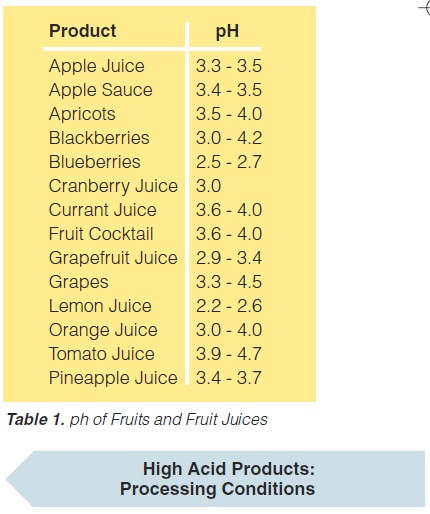
1.2 High-Acid Liquid-Food Products
High-acid food products have a pH value equal to 4.5 or 4.6 or less. These are mainly fruit juices, fruit juice drinks and “belly washers”. High-acid food products are safer than low-acid foods because:
a) they are not prone to pathogenic bacteria and are therefore regarded as safe from the point of view of public health;
b) bacterial spores cannot germinate under high-acid conditions and, consequently, cannot cause food spoilage;
c) the sterilising efficiency of any heat treatment increases with decreasing pH. Thus, lower temperatures can be applied in order to achieve commercial sterility;
d) in addition, some organic acids common in fruits specifically decrease the temperature resistance of possible spoilage organisms;
e) the main spoilage microorganisms are yeast, mould, and a few bacteria (Lactobacillus, Streptococcus, and some others). Processing temperatures for high-acid foods are rather low. With few exceptions temperatures of 85 -95°C with holding times of 30 to 15 seconds, sometimes a few minutes, are sufficient (60). However, there are some exceptions, particularly tomato products which may require considerably higher temperatures, often above 100°C. The pH values of a number of fruits and fruit juices (131) are given in table 1.
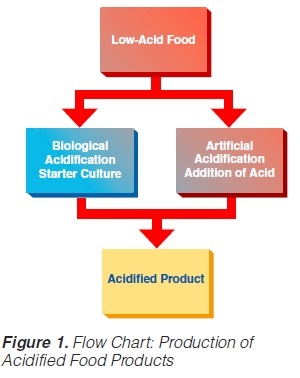
1.3 Acidified Liquid-Food Products
Acidified foods are low-acid products, the pH of which has been lowered into the high-acid range by pre-processing. Such products have the same microbiological advantages as high-acid food products. The acidification process is crucial. It is necessary to achieve an even and low pH throughout the product. Acidification can be carried out biologically by the addition and growth of a starter culture, usually Lactobacillus and/or Streptococcus followed by a ripening period at a suitable temperature. Another possibility is an artificial or chemical procedure in which an acid (usually citric or lactic acid) is added to the product which has to be mixed thoroughly afterwards (Figure 1). To achieve commercial sterility, the acidified product has to be processed after the acidification process, usually by heat treatment, and then packaged.
012.Indirect UHT
 2. Indirect UHT Systems
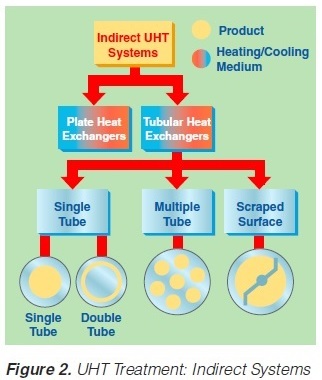
A heat exchange surface separates the product from the heating or cooling media in indirect UHT systems. The heating medium may be either steam or superheated water (Figure 2). A time-temperature diagram for indirect systems is shown in
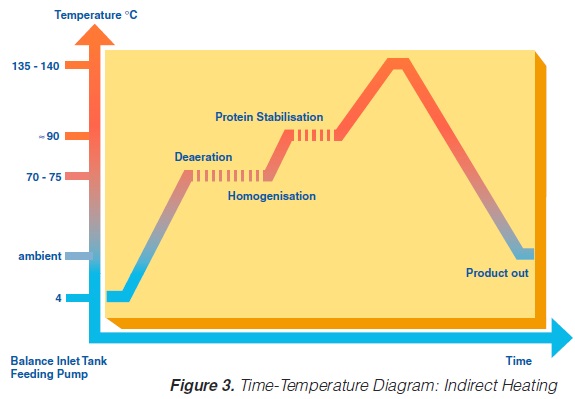
figure 3. Typically, the product enters the steriliser via a balance inlet tank and a centrifugal feeding pump at about 4°C. Subsequently, it is heated to 70 -75°C, at which temperature the product is homogenised. For milk homogenisation, pressures of 200 to 250 kg/cm2 (150 to 200 at the first stage, and about 50 kg/cm2 at the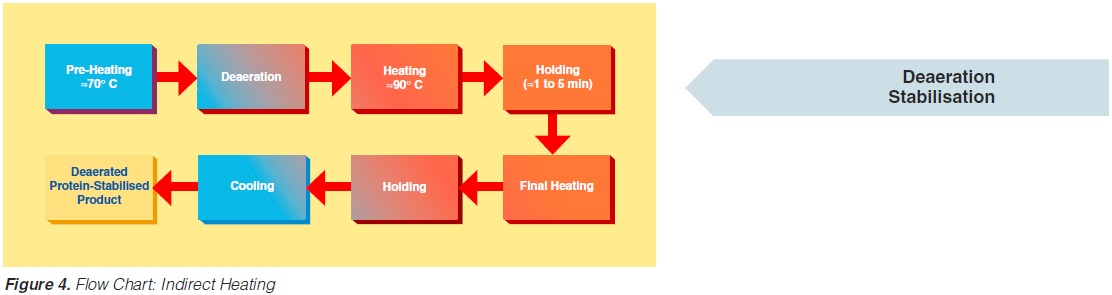 second) are often used. The omogeniser is a positive piston pump which pushes the product through the remaining equipment directly to the aseptic filling machine or into an aseptic tank for subsequent filling. Sterilisation temperatures are usually between 135°C and 140°C. Holding times between 2 and 6 seconds at the sterilisation temperature are common. Though more expensive, downstream (aseptic) homogenisation results in better flavour characteristics for some products. In order to lower the oxygen content of the product, deaeration can be introduced prior to upstream homogenisation. Milk entering the steriliser is normally saturated with oxygen. Since indirect working sterilisers are closed systems, the incoming and outgoing oxygen content of the product is the same. Depending upon temperature, milk may contain 6 to 9 ppm of oxygen (ca 7ppm), (168). Passing a vacuum chamber (deaerator) at high temperature prior to homogenisation (~ 70°C), the oxygen
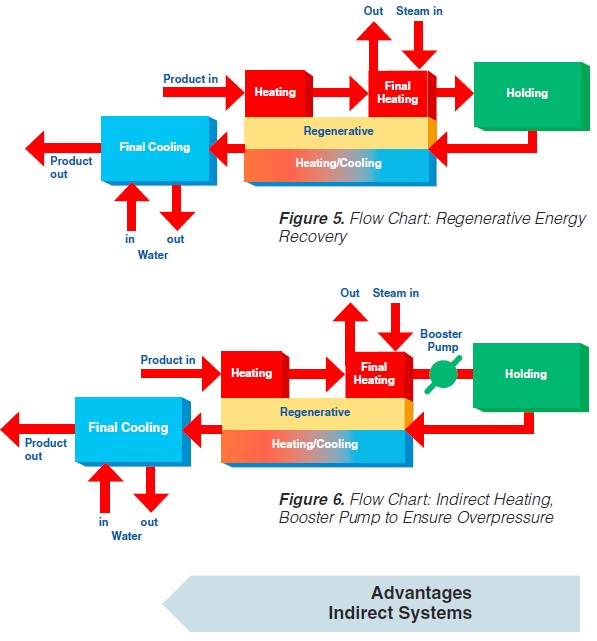
content can be reduced to about < 1 to 3 ppm (0.3 - 0.9 ppm), (168). The degree of deaeration depends upon the temperature and the underpressure applied in the process. During heat processing, deposits form on heat exchange surfaces, particularly in the temperature range > 80°C. In order to reduce this deposit formation and thus prolong the running time, a holding cell can be introduced: the product (milk) is held for a few minutes at a temperature of about 90°C (Figure 4). Indirect systems offer good possibilities for regenerative energy recovery: the incoming productis heated by the outgoing.
013.Direct UHT systems
Direct UHT Systems
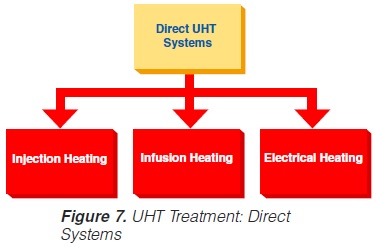 Direct UHT plants feature direct contact between the heating medium and the product. The heating medium is usually steam but electrical heating (“Elecster”, “Ohmic”) has been introduced to a very limited extent(figure 7).
Electrical heating features the passage of an electrical current through the product. Although it is also used for liquids, the system is mainly intended to be applied in the sterilisation of products containing particles. Commercial application is very limited although a number of plants have been installed in the research and development departments of some major food and animal-feed processing companies. One problem is the difference in electrical resistance which can exist between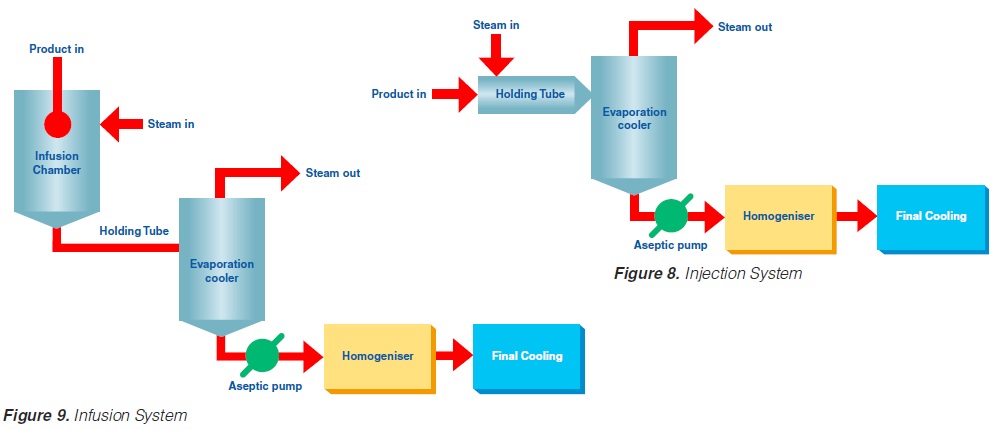 the liquid and solid phases. Other problems generally associated with the processing of products containing particles are those of separation during processing and aseptic transfer, and mechanical damage to particles softened by processing.
 Injection implies direct steam injection into the product. In infusion plants, the product is infused into a steam chamber.
 Injection and infusion systems must be operated with culinary steam.
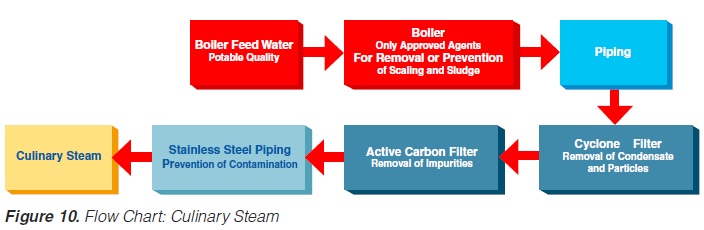
The minimum requirements outlined in figure 10 must be observed for the steam in such plants (not necessary for electrical heating). Indirect working plants should also use culinary steam especially if they are sterilised with steam.
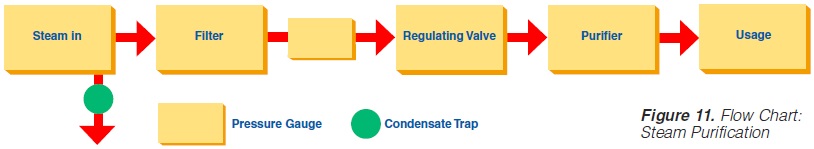
The US Department of Health and Human Services (17) lists the following requirements for culinary steam:
1. Boiler Feed Water: If boiler feed water is treated, the process must be under the supervision of trained personnel. Only compounds complying with Section 173.310 of 21 CFR (258) may be used to prevent corrosion and scale.
2. Boiler Operation: A supply of clean, dry saturated steam is necessary for proper equipment operation. It is recommended that periodic analysis be made of condensate samples.
3. Piping Assemblies: The steam supply line should be as shown in figure 11.
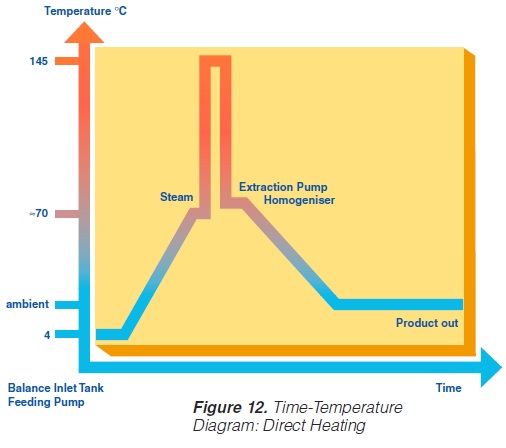 A typical time-temperature diagram for direct heating is shown in figure 12.
The product enters the steriliser via a balance inlet tank and a centrifugal feeding pump at a temperature of about 4°C. It is heated by plate or tubular heat exchangers to about 70°C. At this stage, steam is injected into the product or the product is infused into a steam chamber. Steam condensation increases the temperature almost instantaneously (~ 0.1 sec in injection and ~ 0.25 sec in infusion systems) to the sterilisation temperature which is typically between 145°C and 150°C. The average holding time at the sterilisation temperature is usually around 4 seconds. In both the injection and infusion processes, water condenses in the product and dilutes it. Depending on the temperature difference, an increase in volume of about 10% results. This water must be subsequently removed. The outlet of the holding cell connects to a vacuum chamber. To prevent boiling in the product holding cell, a sufficient overpressure by a suitable restriction device must be introduced. Being exposed to underpressure, the product starts boiling vigorously and steam is flushed off. Careful adjustment of the injection (infusion) temperature and the underpressure in the vacuum chamber guarantees the same dry matter content of the incoming and outgoing product. The resulting pressure drop requires the installation of an aseptic extraction pump for further product transportation. In order to avoid an accumulation of product in the expansion cooler or its emptying, the capacity of both the product feeding pump and the extraction pump at the outlet of the expansion cooler must be carefully
matched.
Cavitation forces during steam condensation and the boiling in the expansioncooler destabilise milk protein and fat. To compensate this effect requires downstream homogenisation which has to be done under aseptic conditions. Homogenisation pressures for milk are usually 200 to 250 kg/cm2 (150 to 200
kg/cm2 at the first stage and about 50 kg/cm2 at the second). The homogeniser pushes the product through the final cooling section of the steriliser, either into a sterile tank or directly to the aseptic filling machine.
In the expansion cooler, not only water is removed from the product but also all other volatile compounds. In addition, the vacuum chamber functions as a very effective deaerator that removes oxygen and other dissolved gases, mainly carbon dioxide (CO2). As a consequence, the freezing point increases. At the outlet of the expansion cooler, the oxygen content of milk is down to ~ 0.1 ppm.
 Advantages of injection and infusion heating are:
a) a lower total heat load, as a result of which fewer chemical changes are inflicted on the product;
b) less scaling, particularly in the temperature range of 70°C and above resulting in longer production runs (less frequent cleaning and sterilisation);
c) the low oxygen content in the product increases the stability of some vitamins and, during storage, reduces flavour changes caused by oxidation;
d) more suitable for viscous products.
Recently, special UHT heat exchangers have been developed combining direct and indirect heating. In one assembly, tubular heating and steam injection have been combined. The product enters at ~4°C and is heated to 95°C by tubular heat exchangers. It then passes a holding cell at the same temperature to stabilise the protein. Steam injection raises the temperature almost instantly to 140-150°C. The product is held at this temperature for a few seconds before being cooled down. Pre-cooling is performed in a tubular heat exchanger where the heat energy is utilised for regenerative heating. The injected steam is flushed off as vapour in a vacuum cooler. The temperature drops to 80°C. Aseptic homogenisation is needed. Subsequently, the product is cooled down to ambient and filled aseptically.
014. Plant Sterilisation
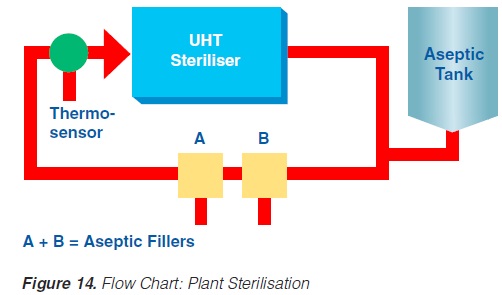 Prior to production, the equipment must be sterilised. This can be achieved either by superheated water or by steam. Because of the expansion and infusion vessels, direct working systems must be sterilised by steam. It is essential that the temperature controller/guarding sensor is placed at the most sensitive spot, usually somewhere in the return.
If superheated water is used to sterilise the plant, the temperature, time, and flow rates are critical (142). Possible air pockets and the interface between the product steriliser and the aseptic tank circuit are significant. Air is effectively removed from the system if the flow rate is > 1.5 m/second.
An additional sterilisation circuit is required in installations operating through an aseptic tank. The sterilisation medium is always steam. In steam sterilisation processes, a possible problem is condensate which must be removed from the system.
Sterilisation of the aseptic filling equipment is always performed separately either by heat alone or by chemicals and heat. Attention should be paid to the interface between the product line and the filler.
02.Aseptic packaging
Requires 90 POINTS in the General category.021. General
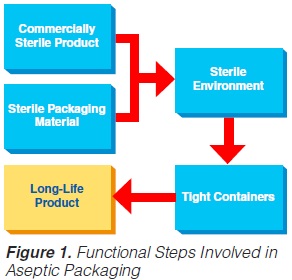 UHT processing results in a commercially sterile product. The task of the aseptic packaging operation is to:
a) maintain the high microbiological quality of the product for the length of its intended shelf life; and
b) retain consumer acceptance with regard to the flavour, texture and nutritional value of the product during its promised shelf life.
Four different principles of aseptic packaging are distinguished (74):
a) filling in a sterile working area;
b) aseptic filling into pre-formed containers;
c) aseptic filling into pre-formed sterile containers; and
d) the aseptic form-fill-and-seal method.
By and large, only the aseptic form-fill-and-seal method will be covered, which is also the best and most successful technology. Such an aseptic packaging operation requires several functional steps (figure 1) (60, 61, 74, 86).
022. Sterilisation of the Packaging Material
2.Sterilisation of the Packaging Material
In aseptic packaging procedures, sterilisation of the packaging material (food contact surface) is achieved with few exceptions by chemical means (61). By far the most common chemical used for this purpose is hydrogen peroxide (H2O2) (93, 142). Of importance are the microbiological efficiency of the sterilisation process and the elimination of the chemical which might get into the filled product as a residue.
Depending on the make of the aseptic packaging equipment, different means of applying the sterilant are used: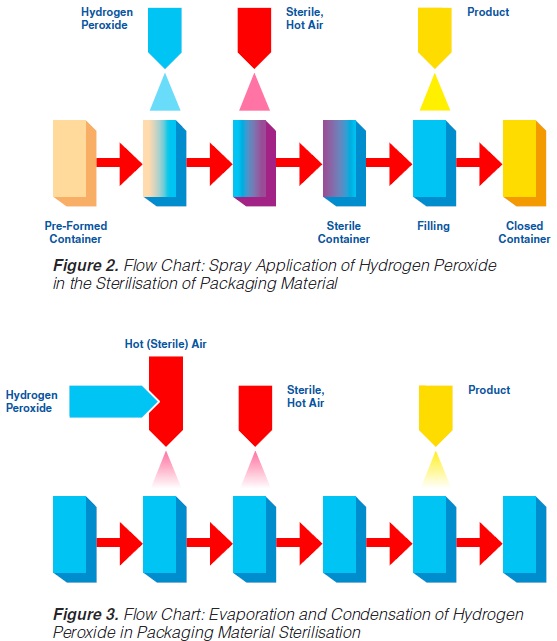
1) spray;
2) vapour;
3) roller systems;
4) immersion bath, etc.
2.1 Spray Application
The spraying (“fogging”) of hydrogen peroxide is used in some aseptic packaging systems which operate intermittently and use pre-formed blanks (61, 74, 93, 171).
A certain amount of H2O2 is sprayed into each pre-erected container through a spray nozzle (figure 2). For proper function (sterilisation), the food contact surface of the container needs to be covered completely with the spray solution. Because of the hydrophobic characteristics of plastic materials in general and polyethylene in particular, it has been found (91, 145) that only 20-30% of the carton surfaces are wetted. In spite of this, good killing effects were achieved: up to 6 log reductions when tested with Bacillus subtilis spores have been reported (145), probably because of the subsequent evaporation.
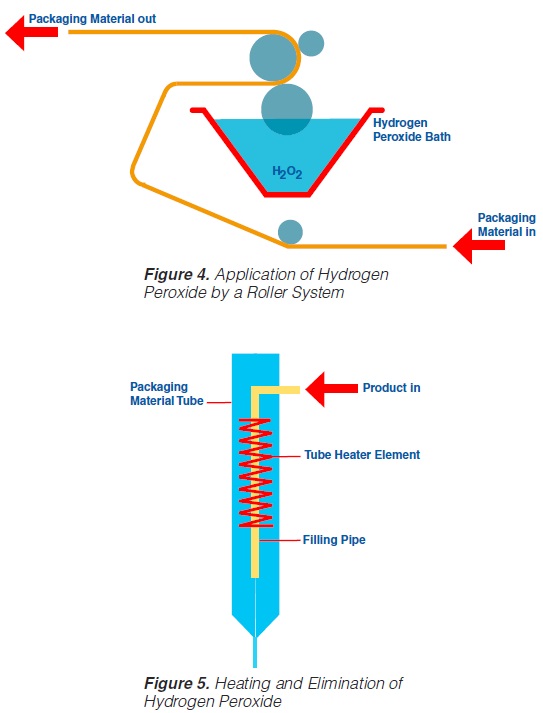
Hot sterile air is blown into the container to attain the temperature necessary for the sterilisation process and to remove the H2O2 from the food contact surface. Using sterile air at
180°C for drying, 5 to 7 decimal reductions of Bacillus subtilis spores were attained (91, 113).
The killing efficiency of low concentrations (~ 0.5% or less) of hydrogen peroxide was greatly enhanced by the simultaneous use of ultraviolet radiation (44, 45).
2.2 Application by Vapour
In systems applying hydrogen peroxide by vaporisation, liquid H2O2 is injected into a stream of hot (sterile) air, then vaporised and condensed on the surfaces to be sterilised (93). A better coverage
of surfaces is obtained since the condensing droplets are smaller. Subsequently, the hydrogen peroxide is heated and evaporated by blowing hot, sterile air into the containers (figure 3).
2.3 Application by Roller System
Roller systems (figure 4) permit the application of liquid hydrogen peroxide on to flat food contact surfaces (59, 60, 61, 74, 93). Packaging material sterilisation thus becomes possible before the containers are formed (figure 4).
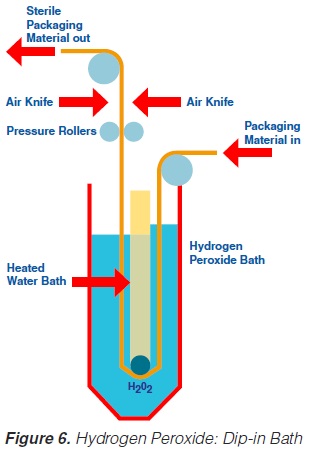
In order to obtain a film of the water like H2O2 liquid covering the total food contact surface, a wetting agent – about 0.2 to 0.3% of PSM, (polyoxyethylenesorbitan-
monolaurate), or equivalent is recommended - has to be added to the hydrogen peroxide. After application of the sterilant on to the food contact surface, the packaging material web is formed into a tube and sealed longitudinally. The actual sterilisation requires the hydrogen peroxide covering the
packaging material food contact surface to be at a high temperature. An electrical element (“tube heater”) provides the temperature necessary (105-110°C) for the sterilisation process and, simultaneously, eliminates the H2O2 (figure 5).
2.4 Use of an Immersion Bath
Likewise, the use of a hydrogen peroxide bath permits sterilisation of a plane packaging material web (59, 61, 69, 73, 74, 93, 171) prior to the actual forming of the container. The packaging material is sterilised by its passage through liquid hydrogen peroxide. The temperature necessary for the sterilisation process is obtained by heating the hydrogen peroxide solution indirectly by means of a water bath which is placed inside the H2O2 bath (figure 6). A concentration of 30%, a temperature of 70°C and an exposure time of about 10 seconds are necessary to achieve sufficient killing of bacterial endospores (74). In some models, the hydrogen peroxide is removed from the packaging material:
a) by a pair of pressure rollers that squeeze the excess chemical back into the hydrogen peroxide bath; and
b) by a pair of air knives that blow hot, sterile air on to both sides of the packaging material web.
After passage through the bath and removal of the hydrogen peroxide, the sterile, flat packaging material web is formed into a tube and sealed longitudinally.
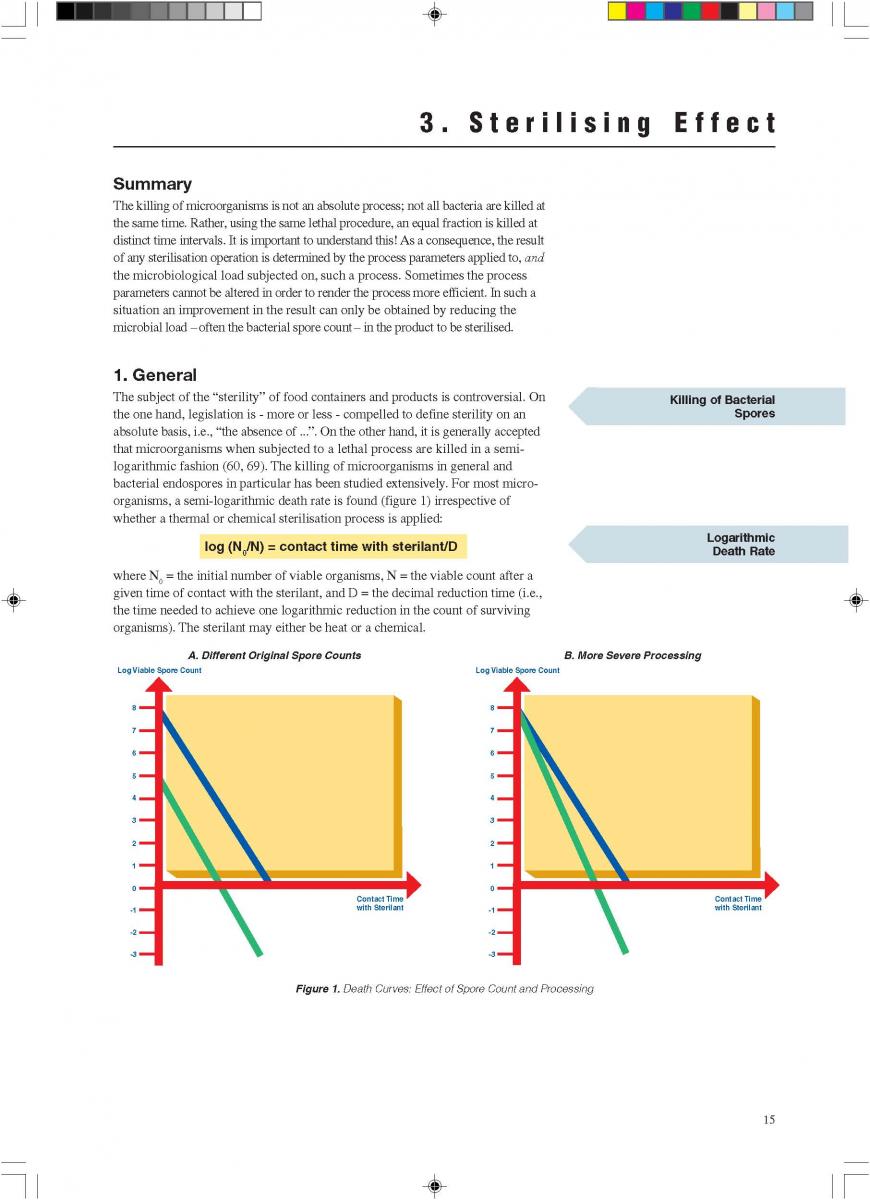
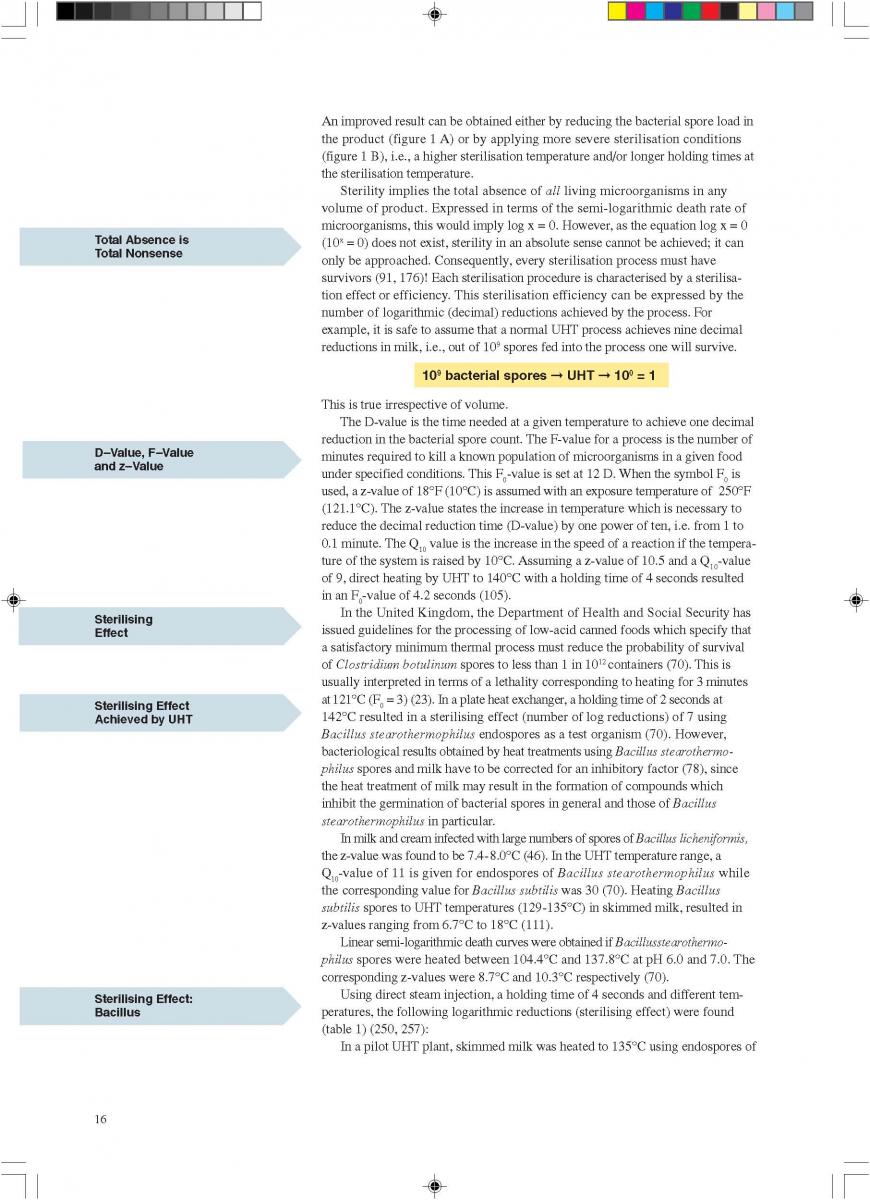
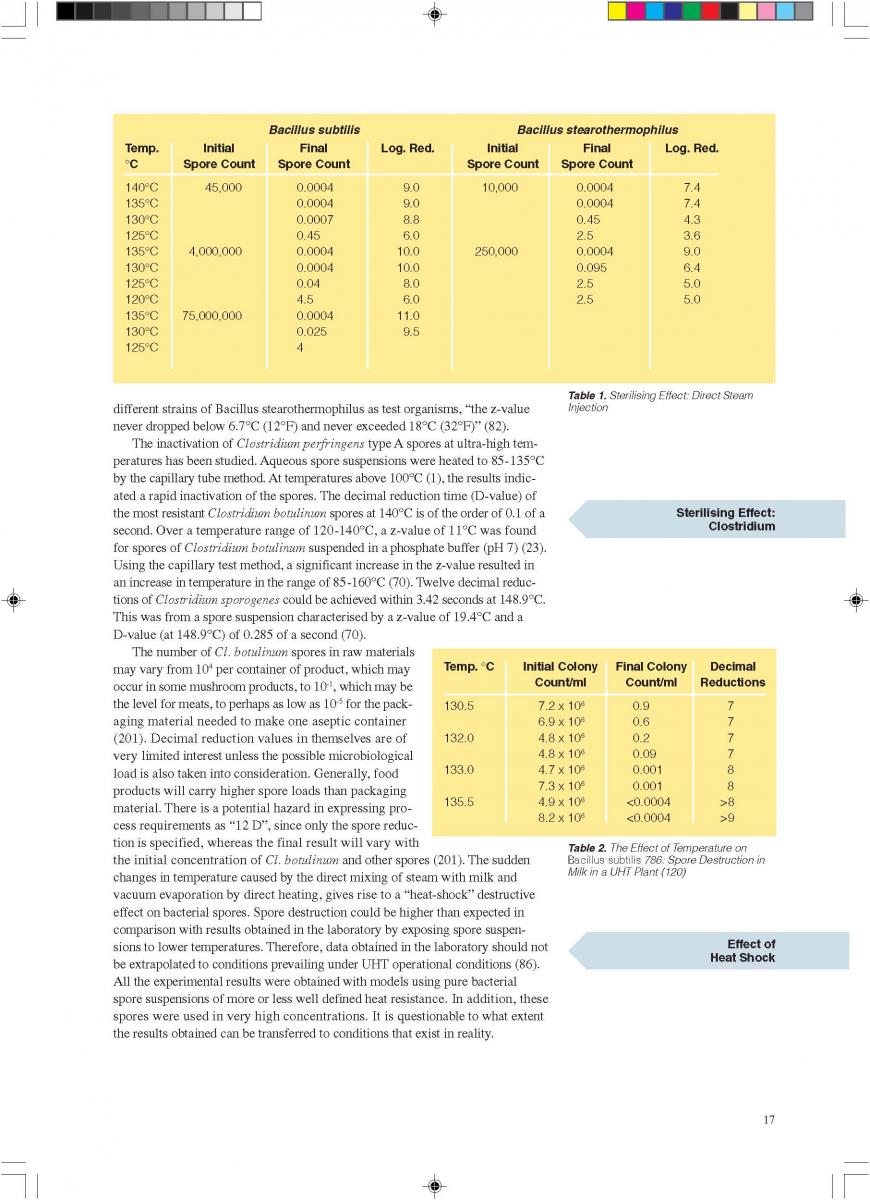
04. H2O2 as a sterilant
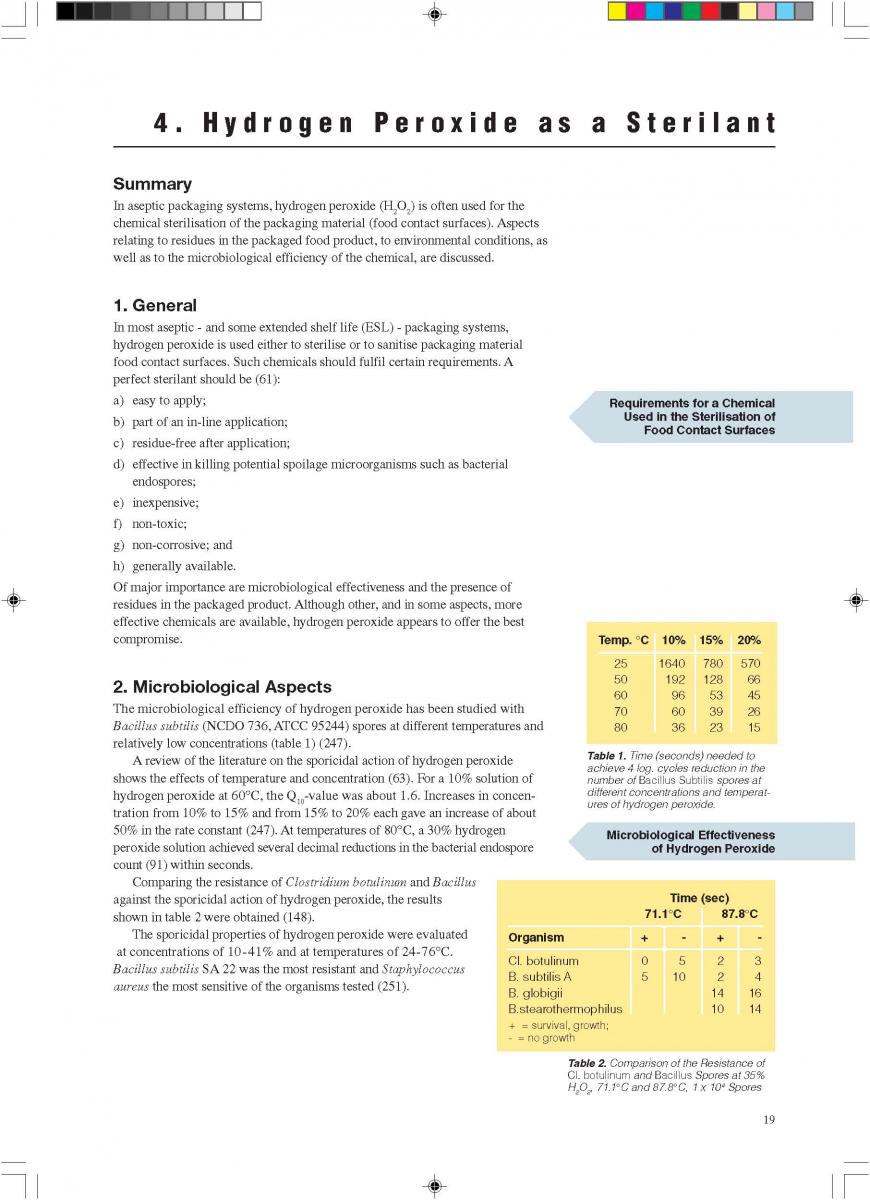
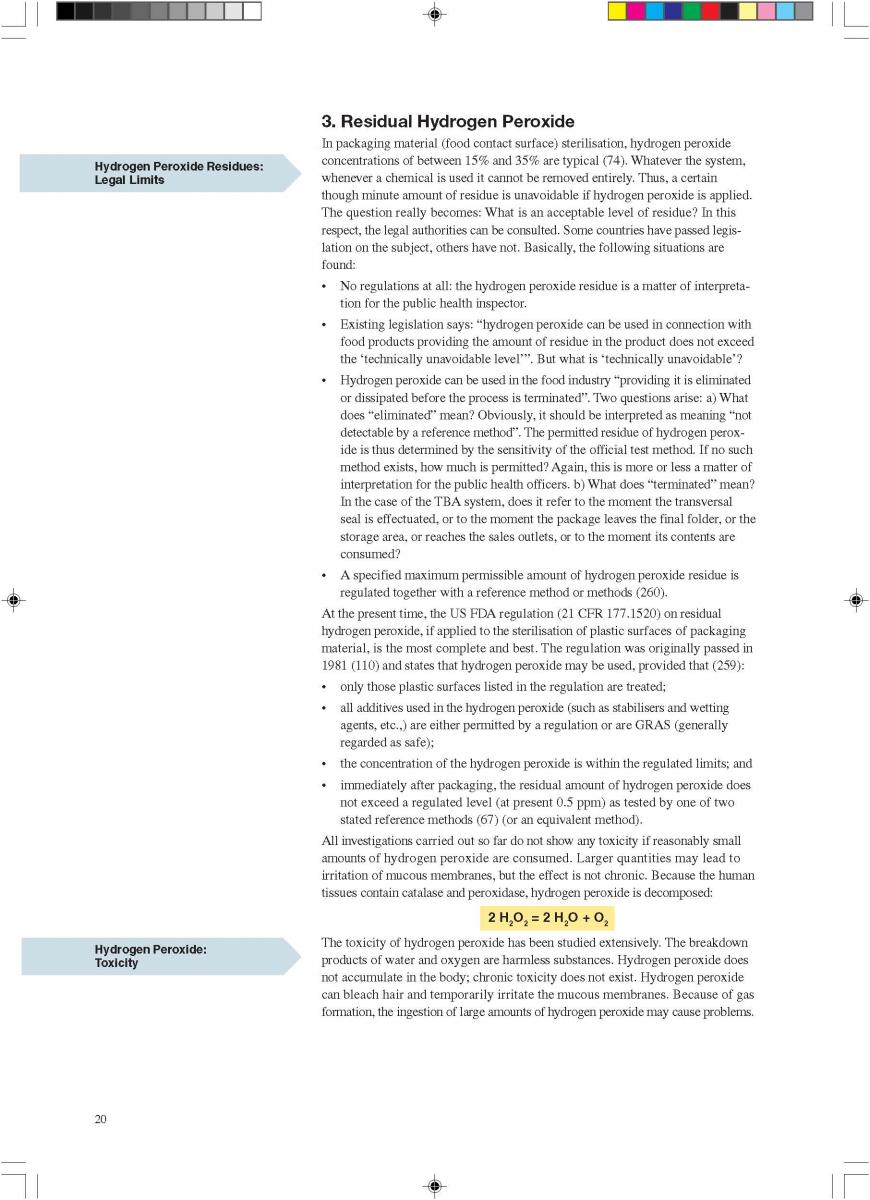
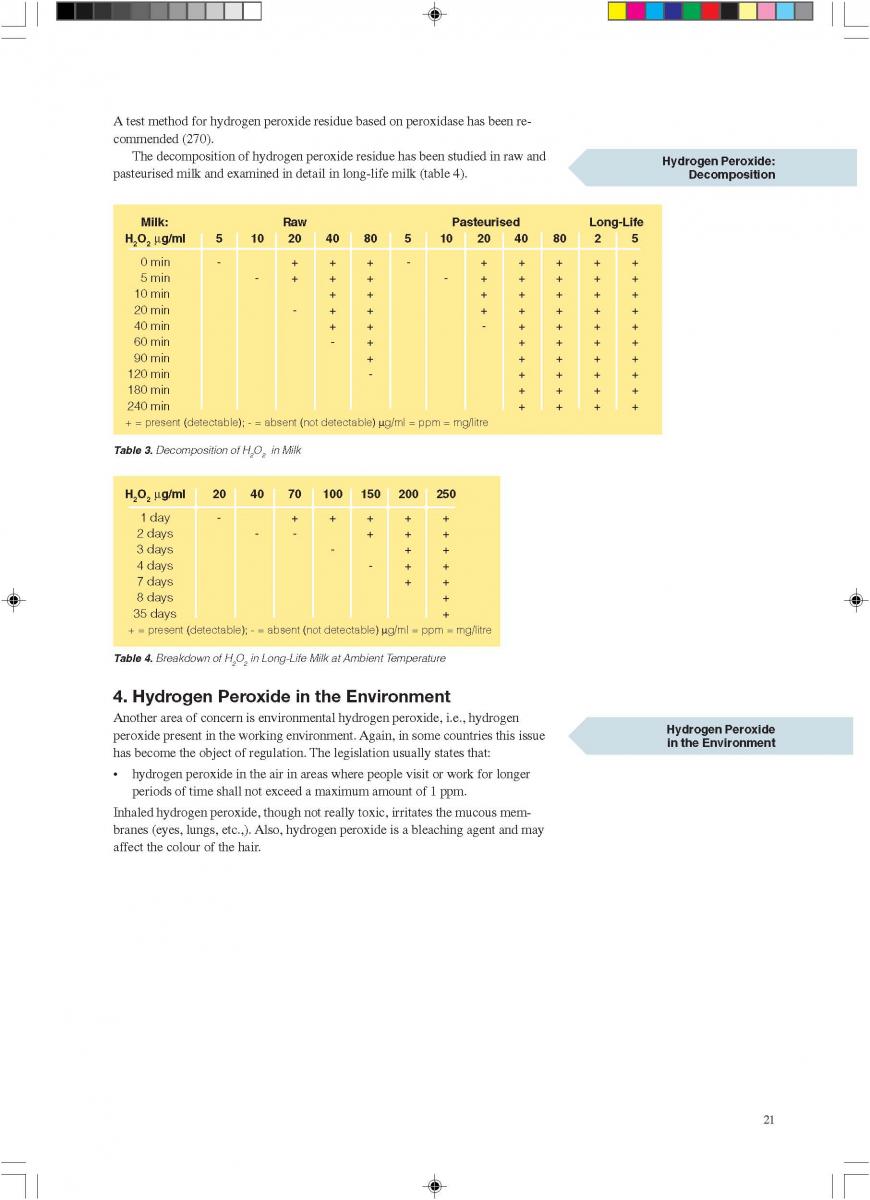
05. Packaging material
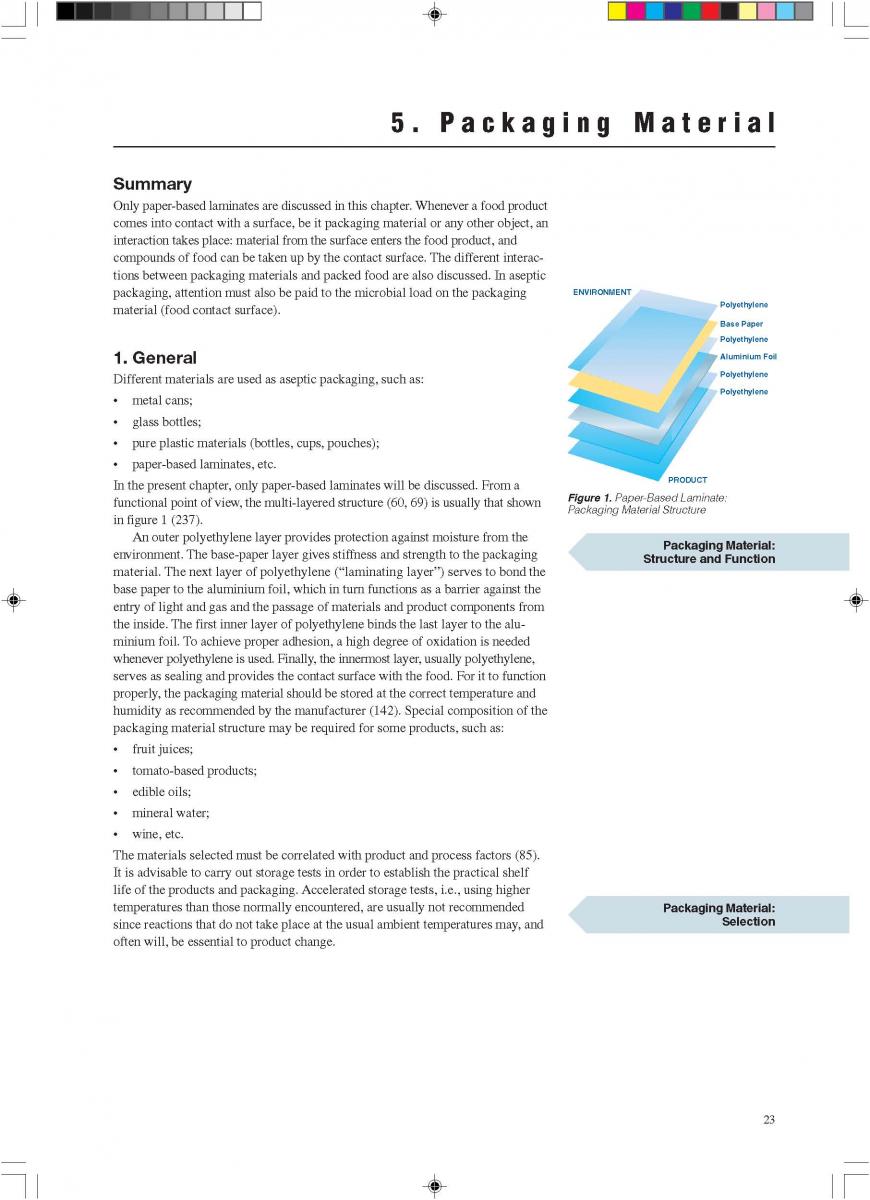
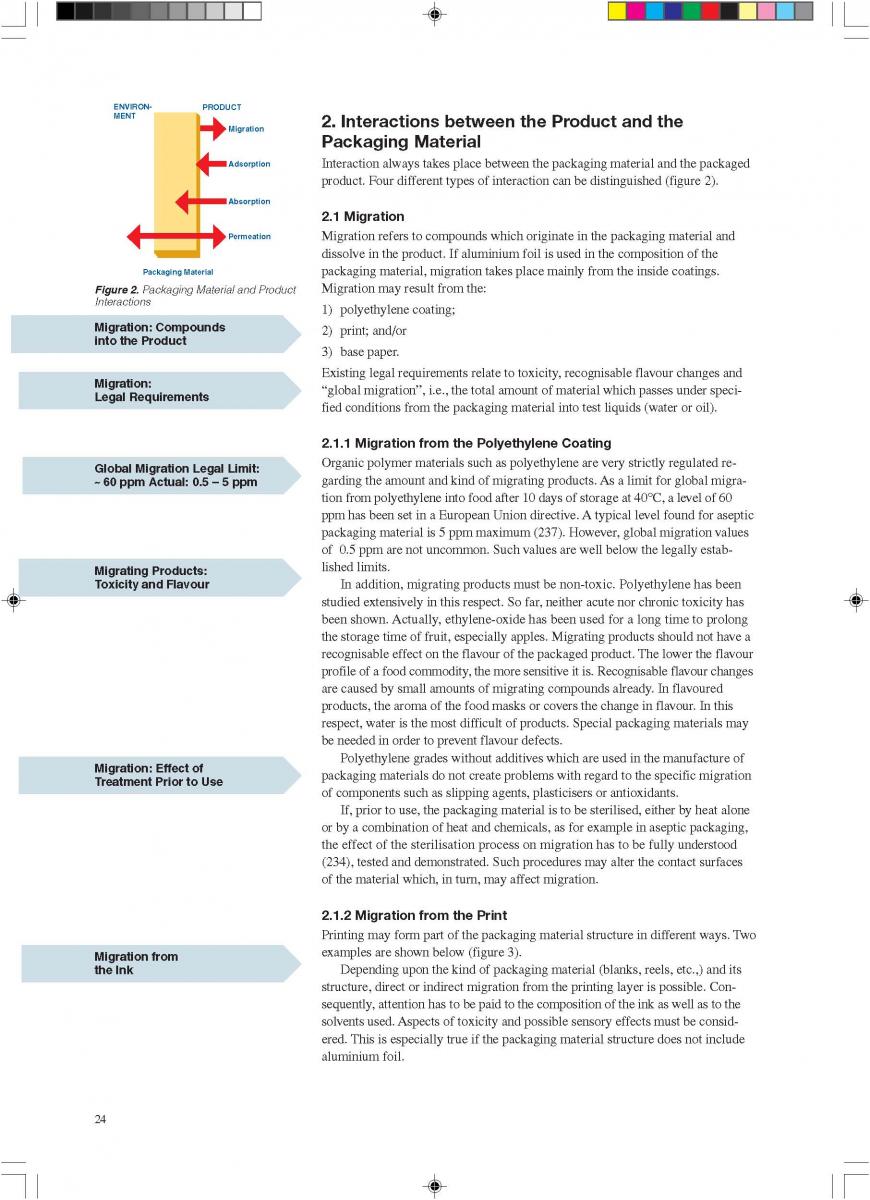
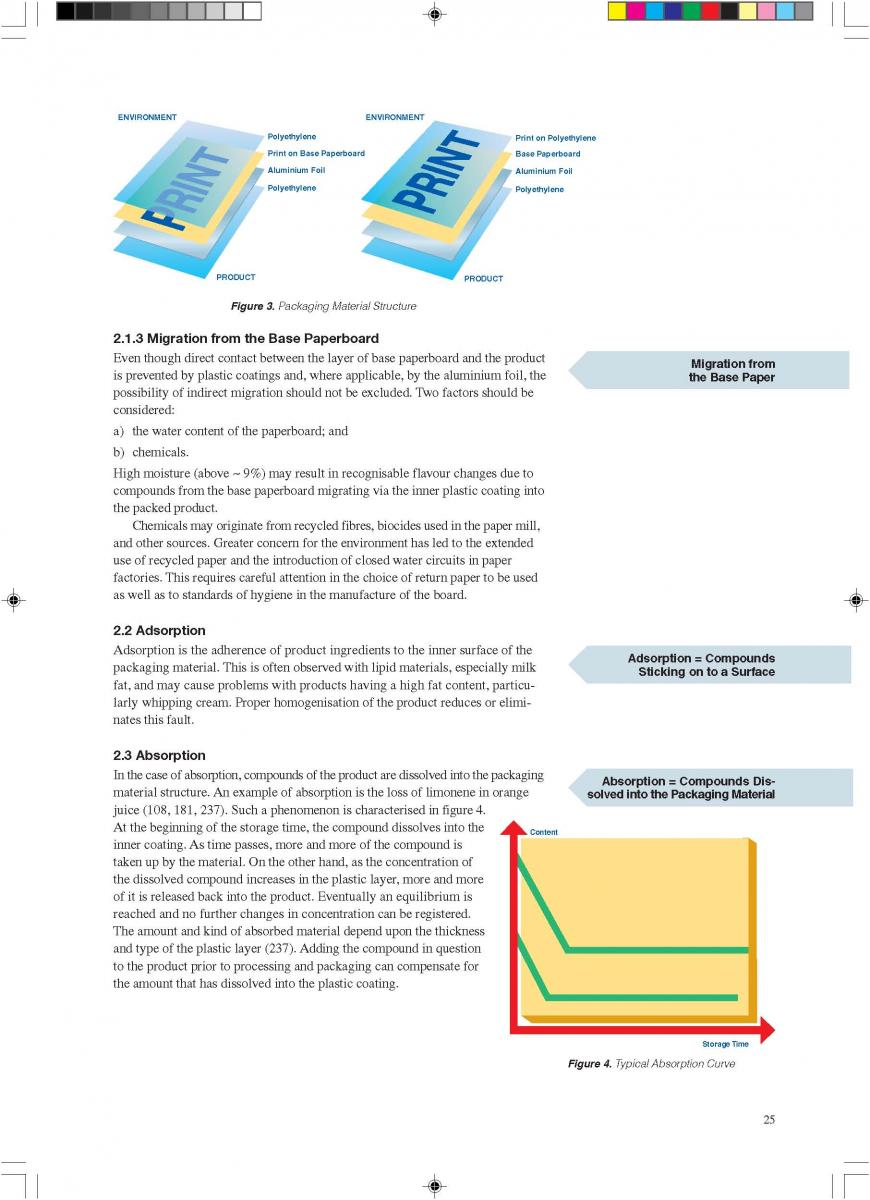
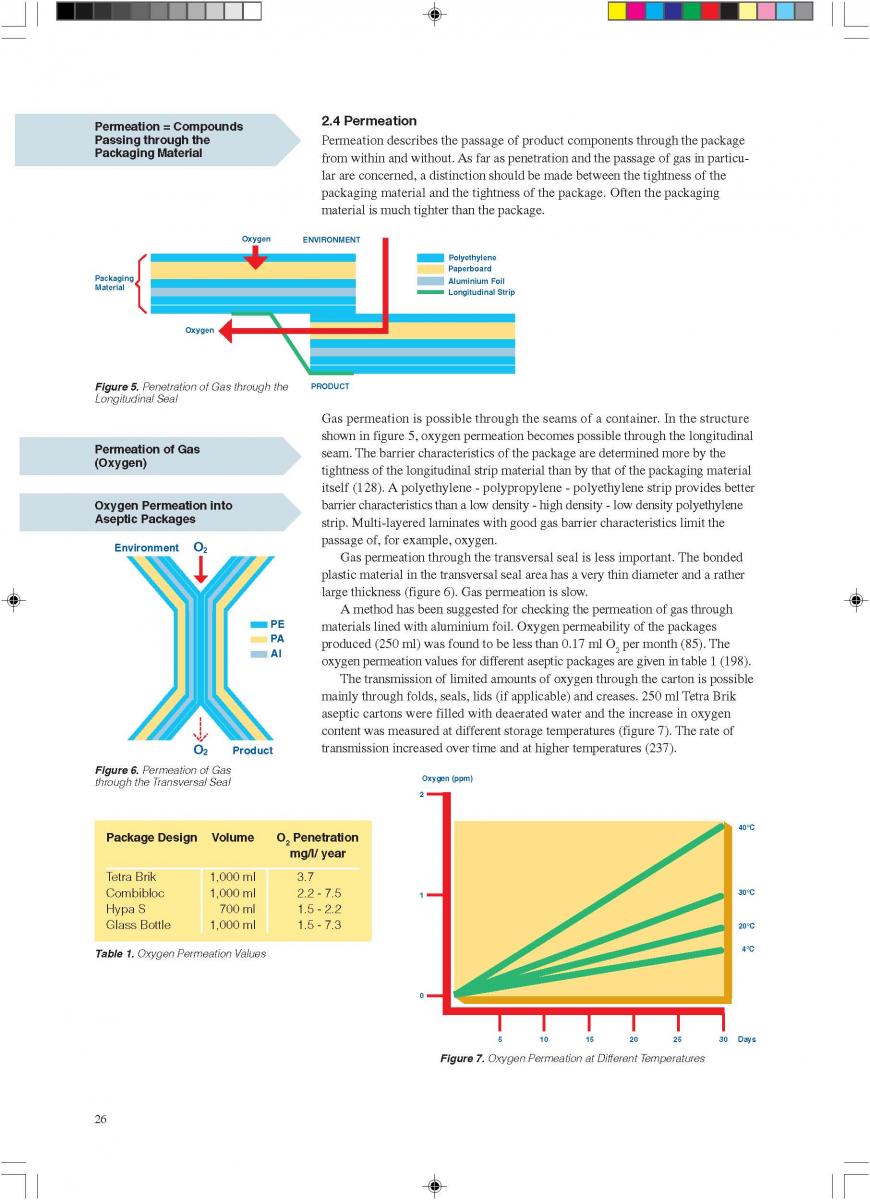
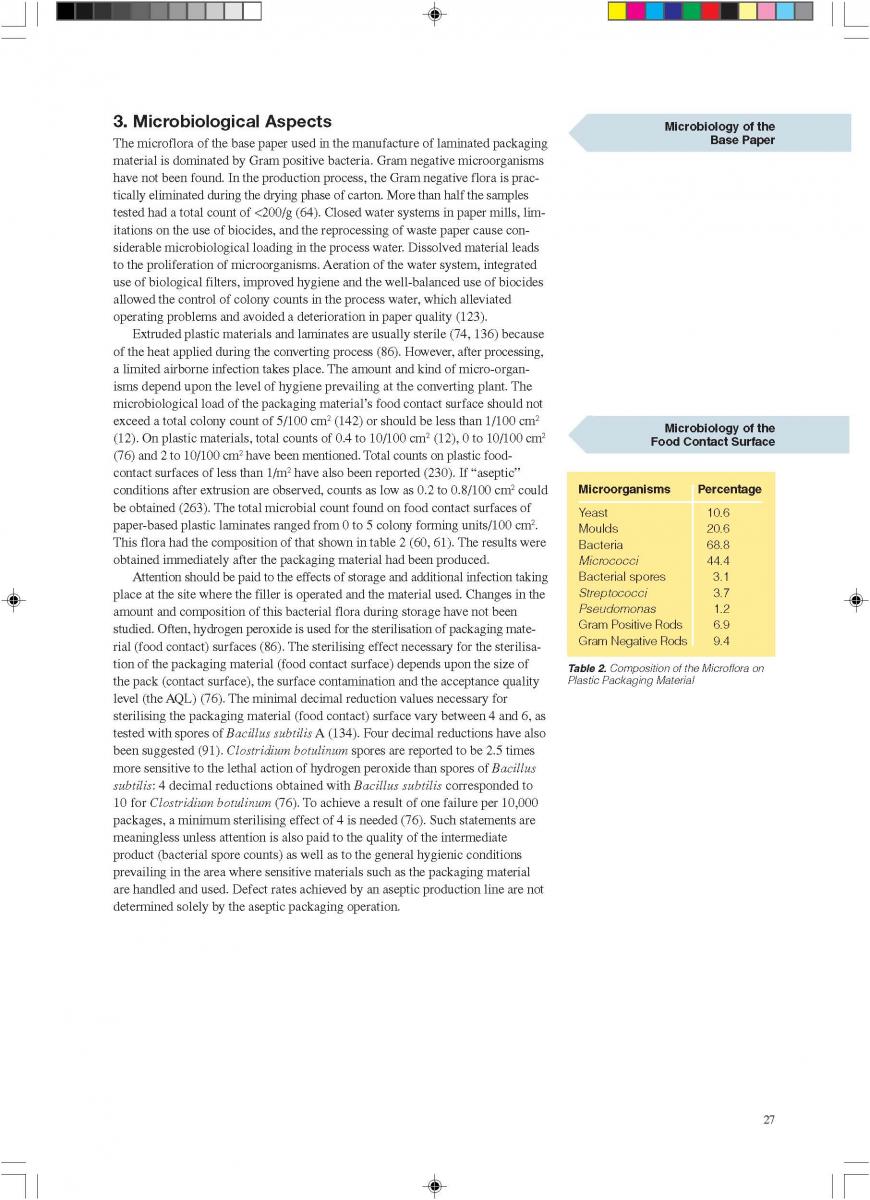
06. Application of microbiology to UHT processing and aseptic packaging
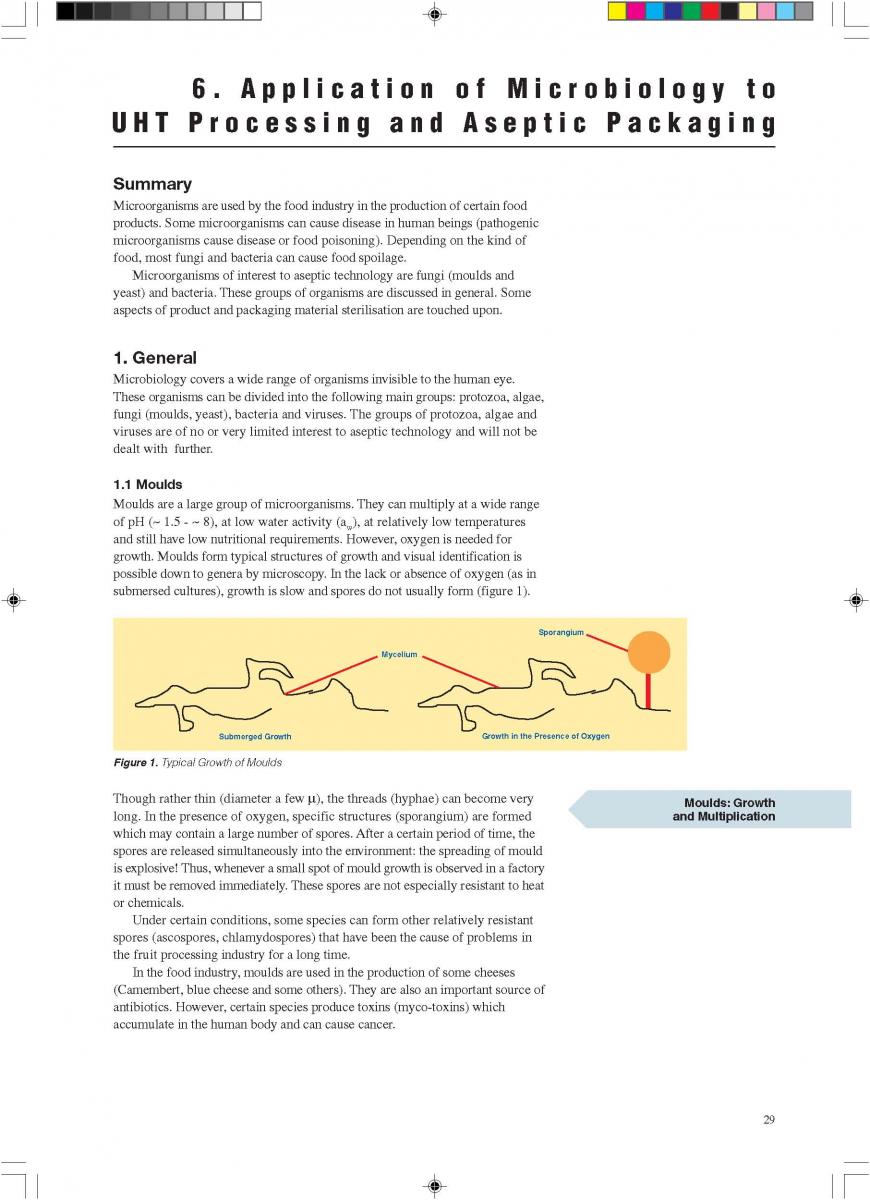
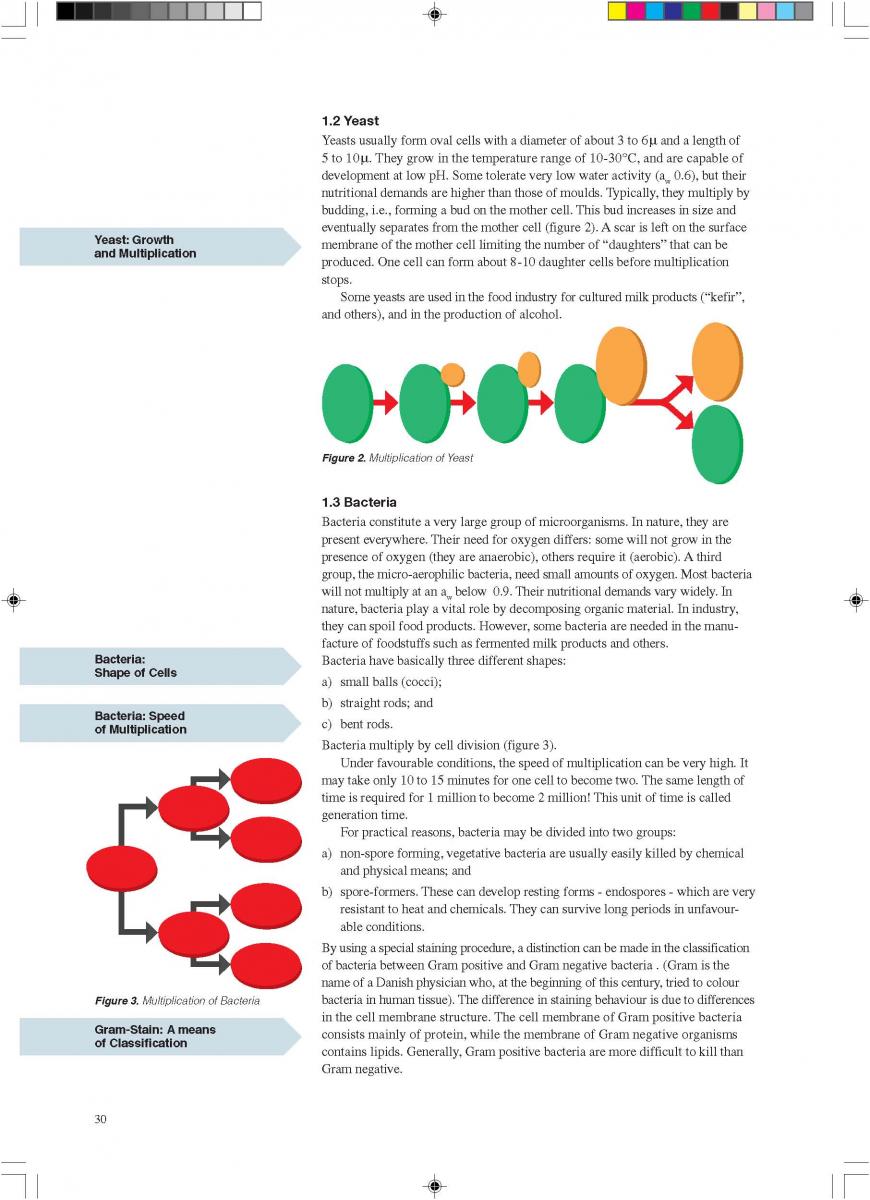
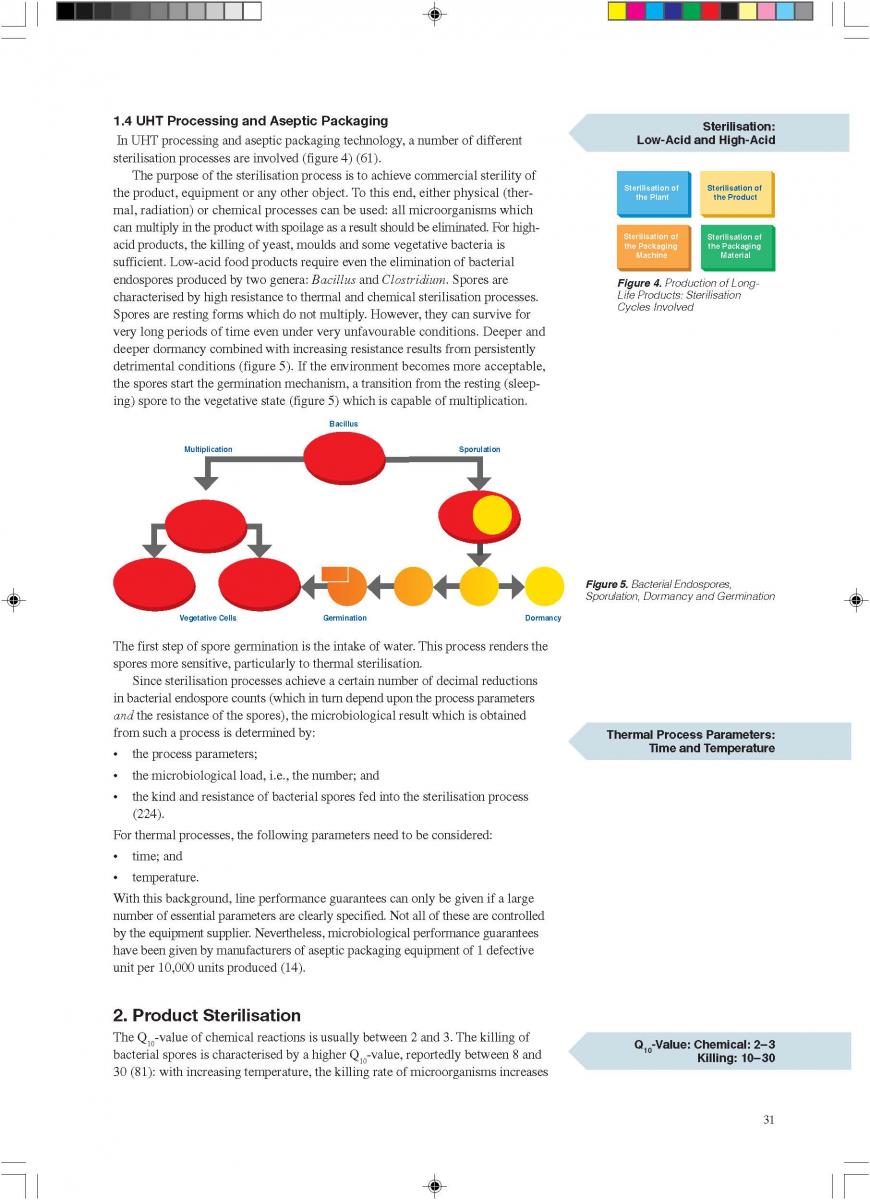
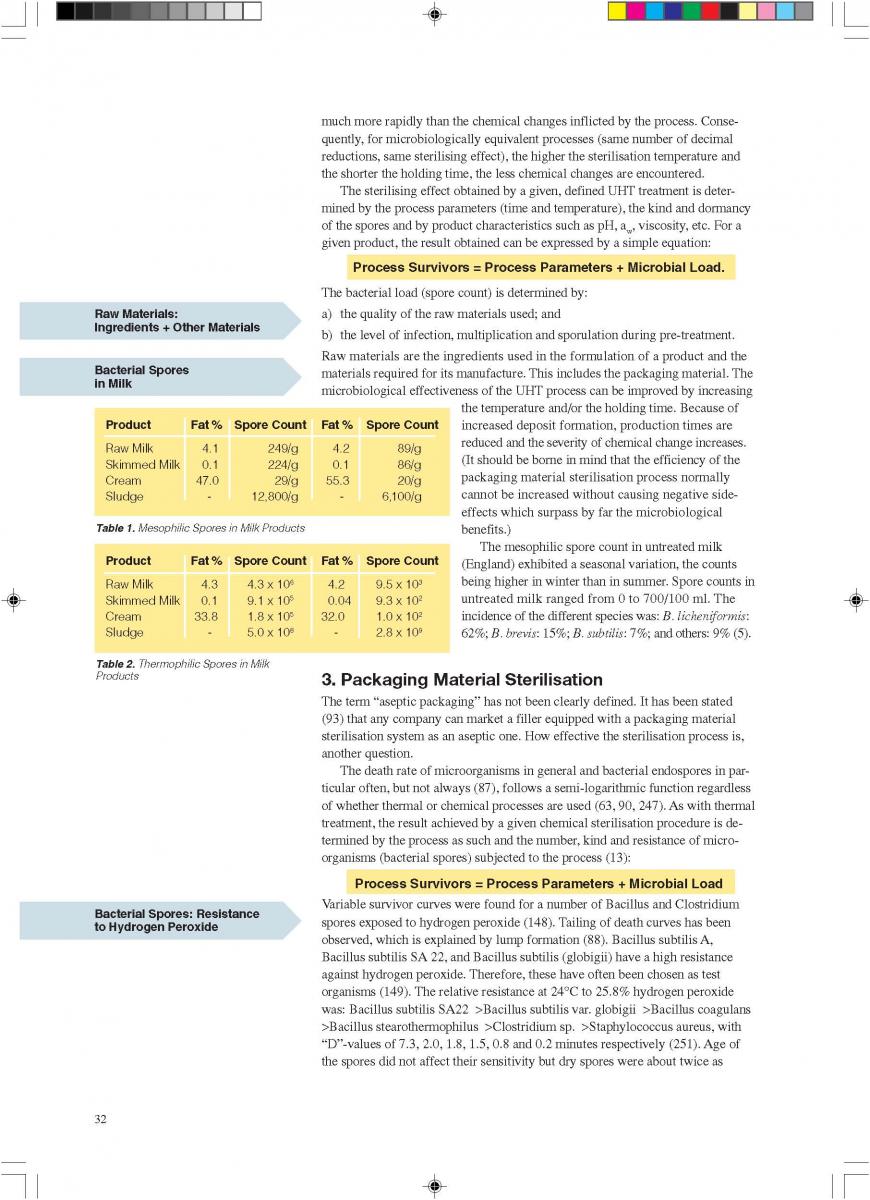
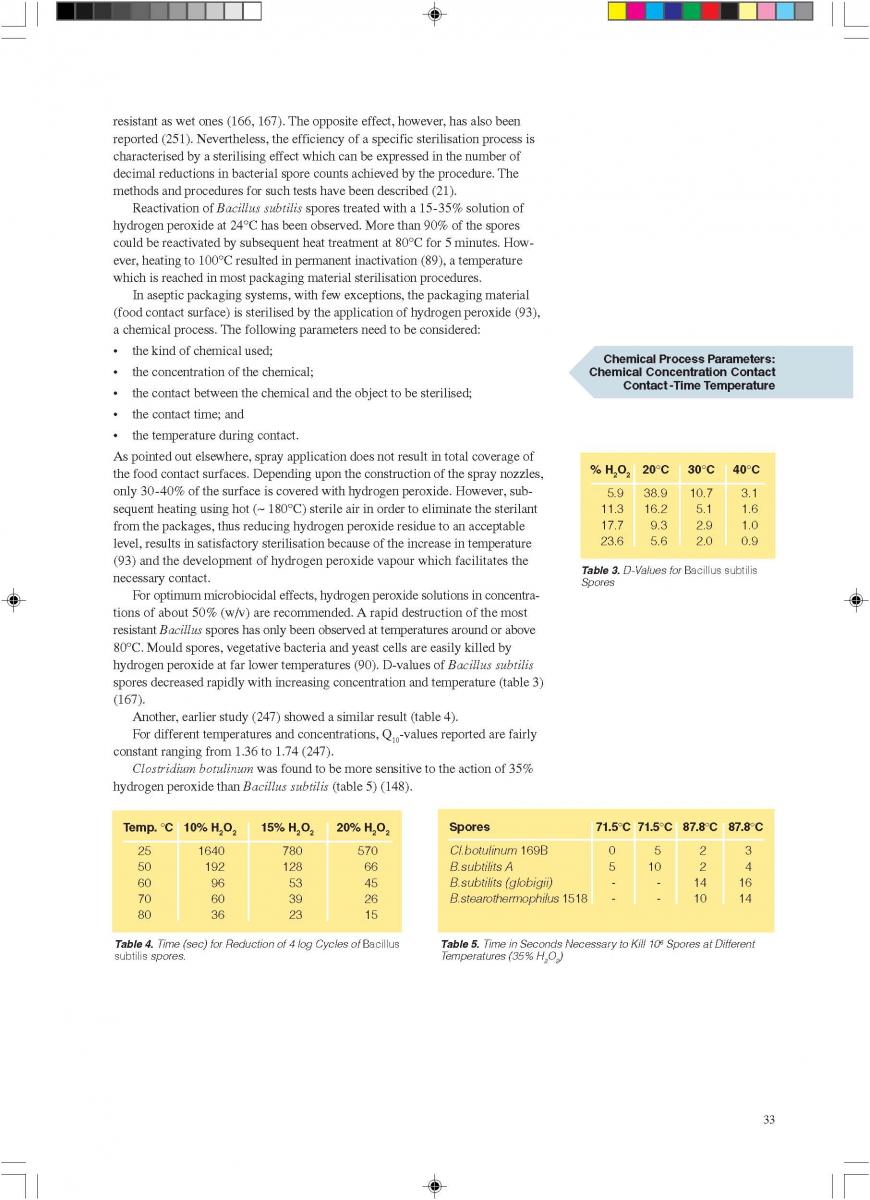
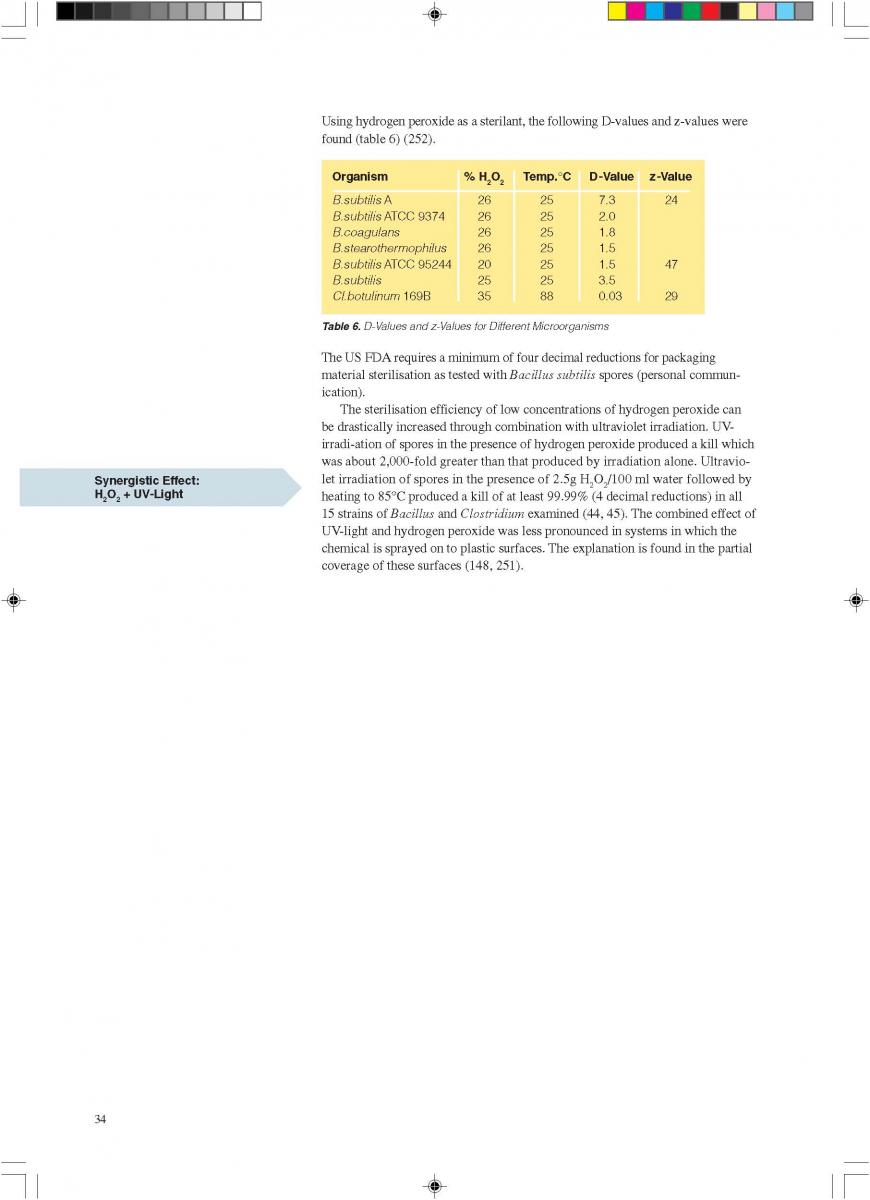
07. Installation
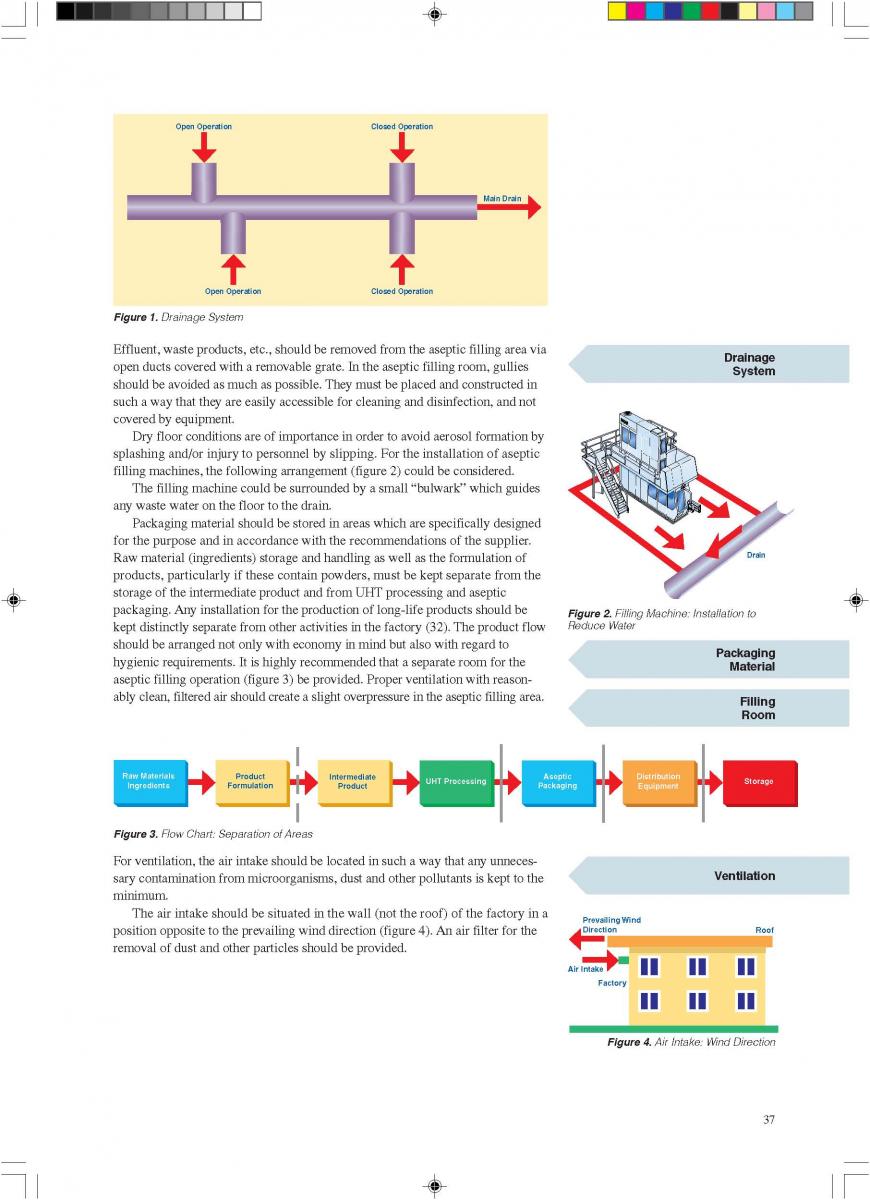
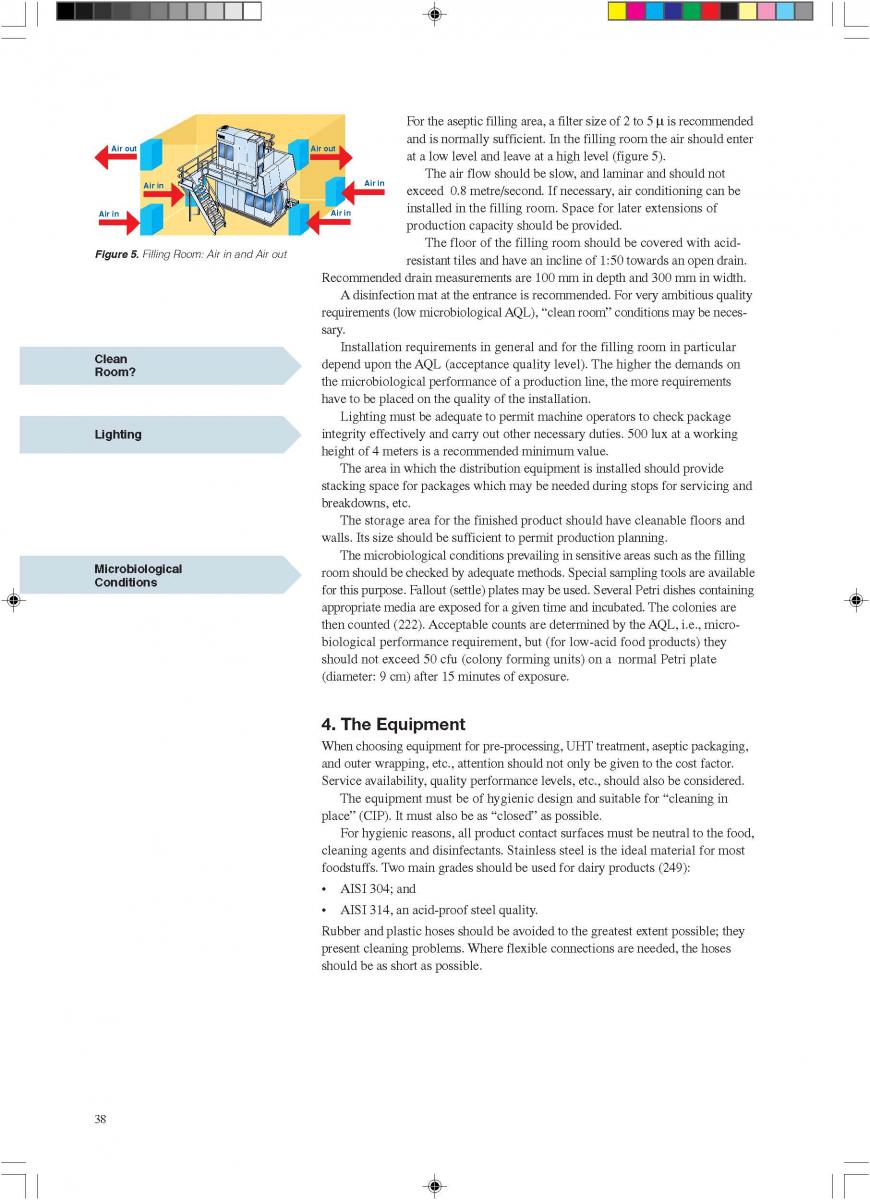
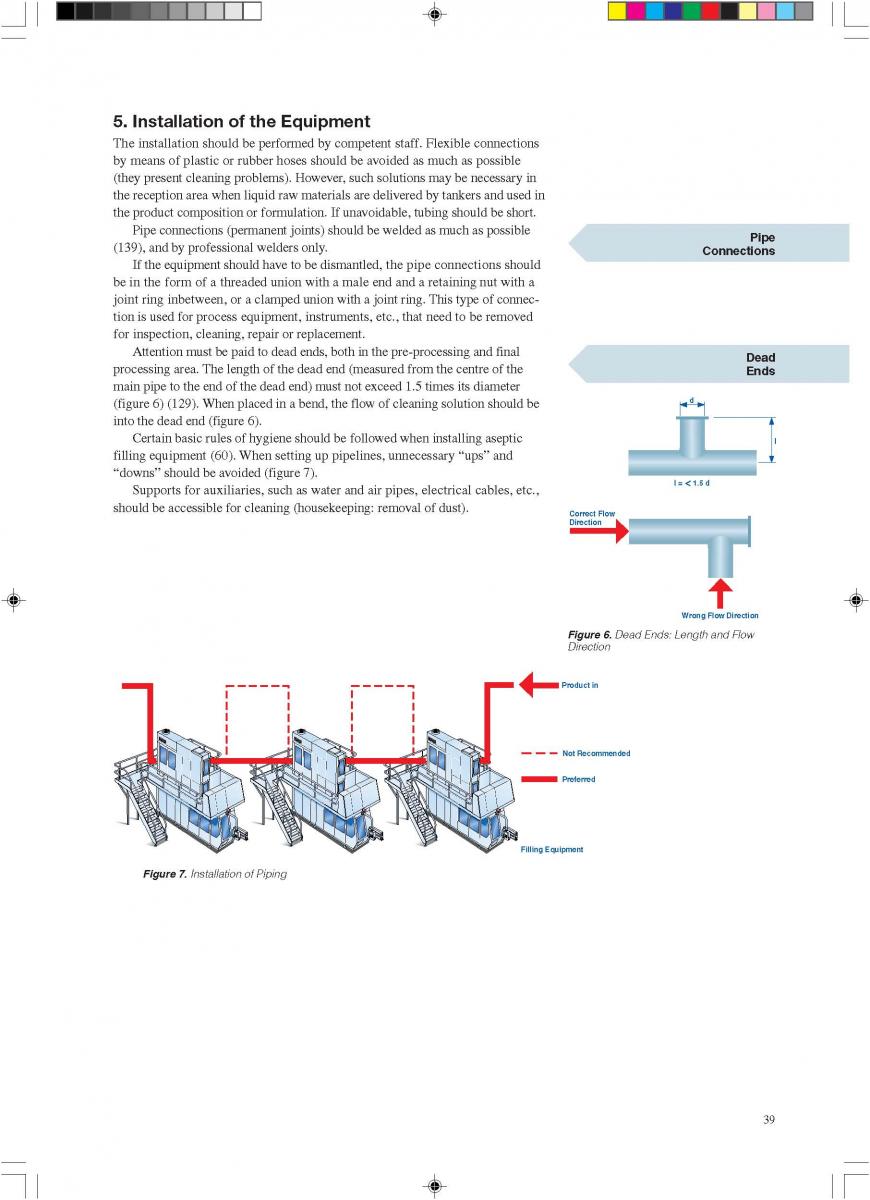
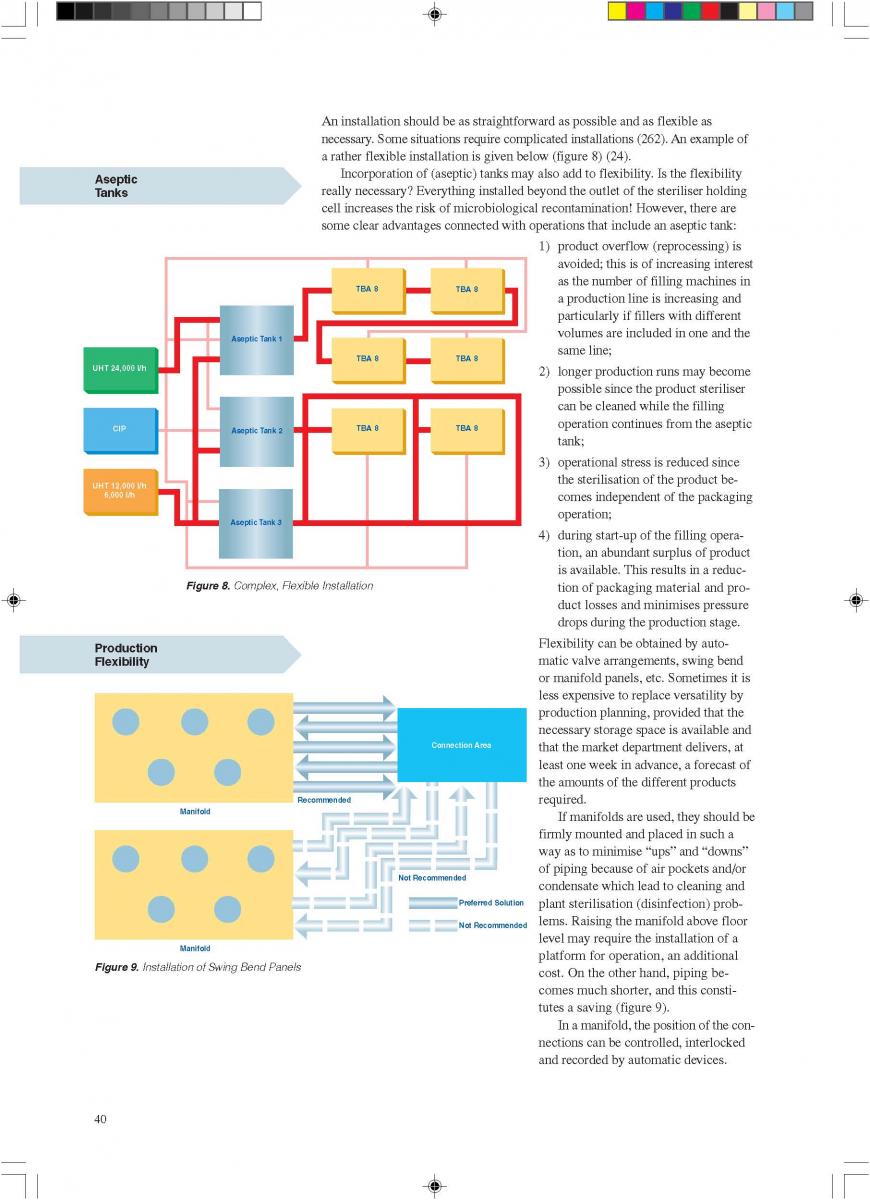
08. Cleaning and house keeping
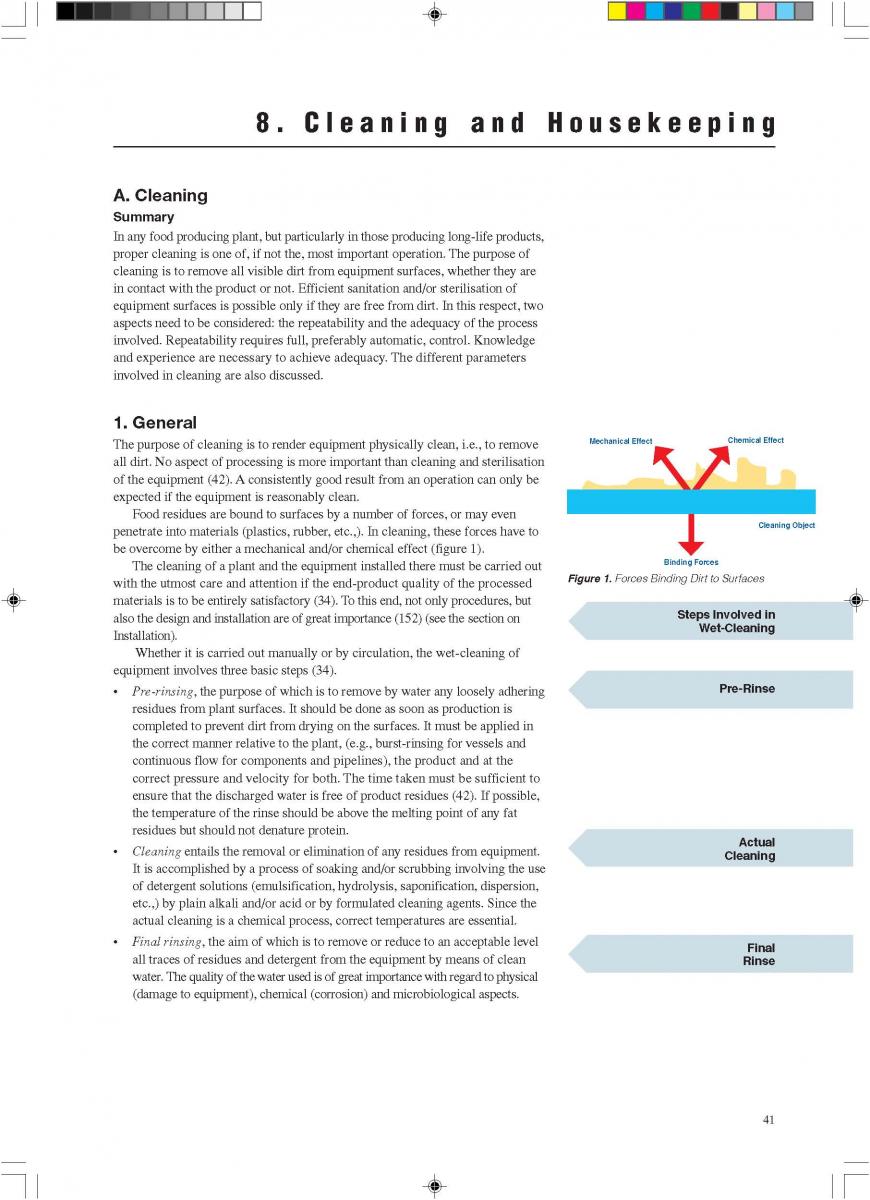
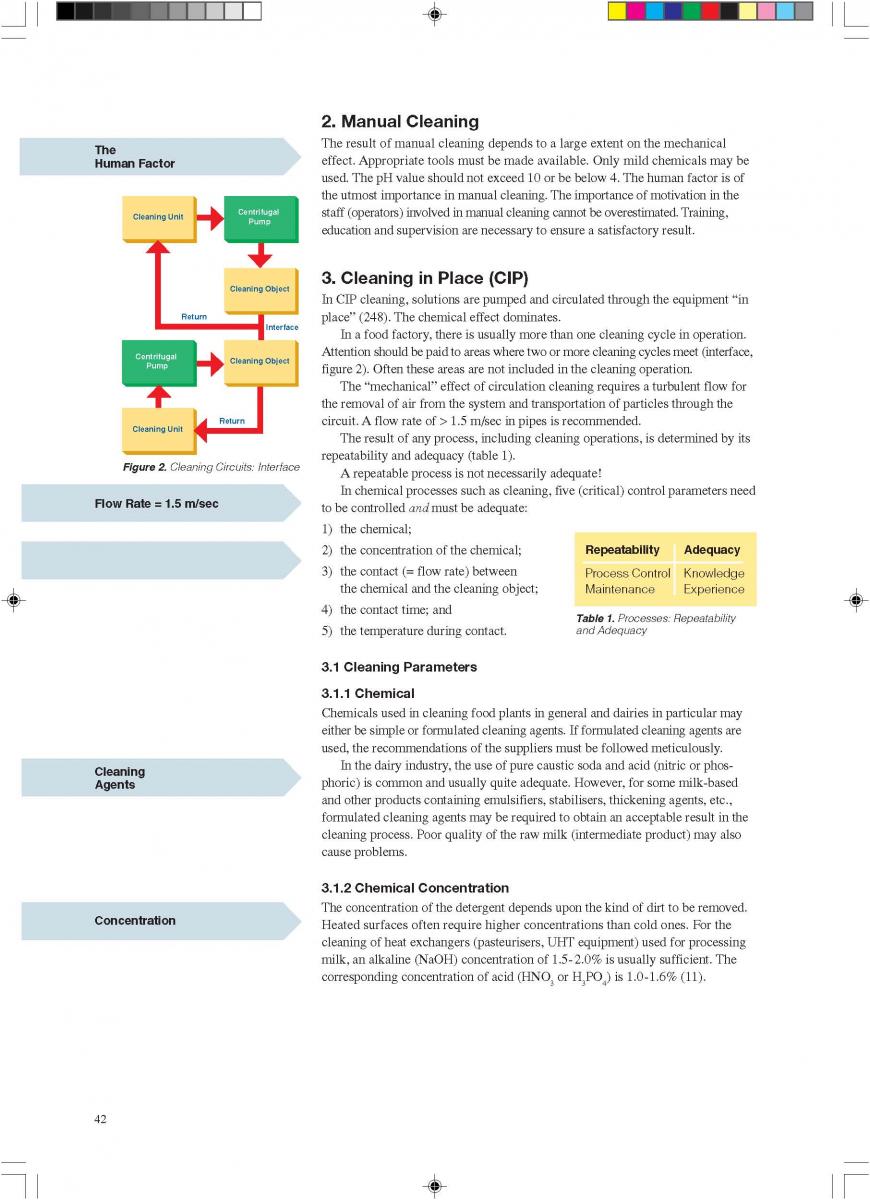
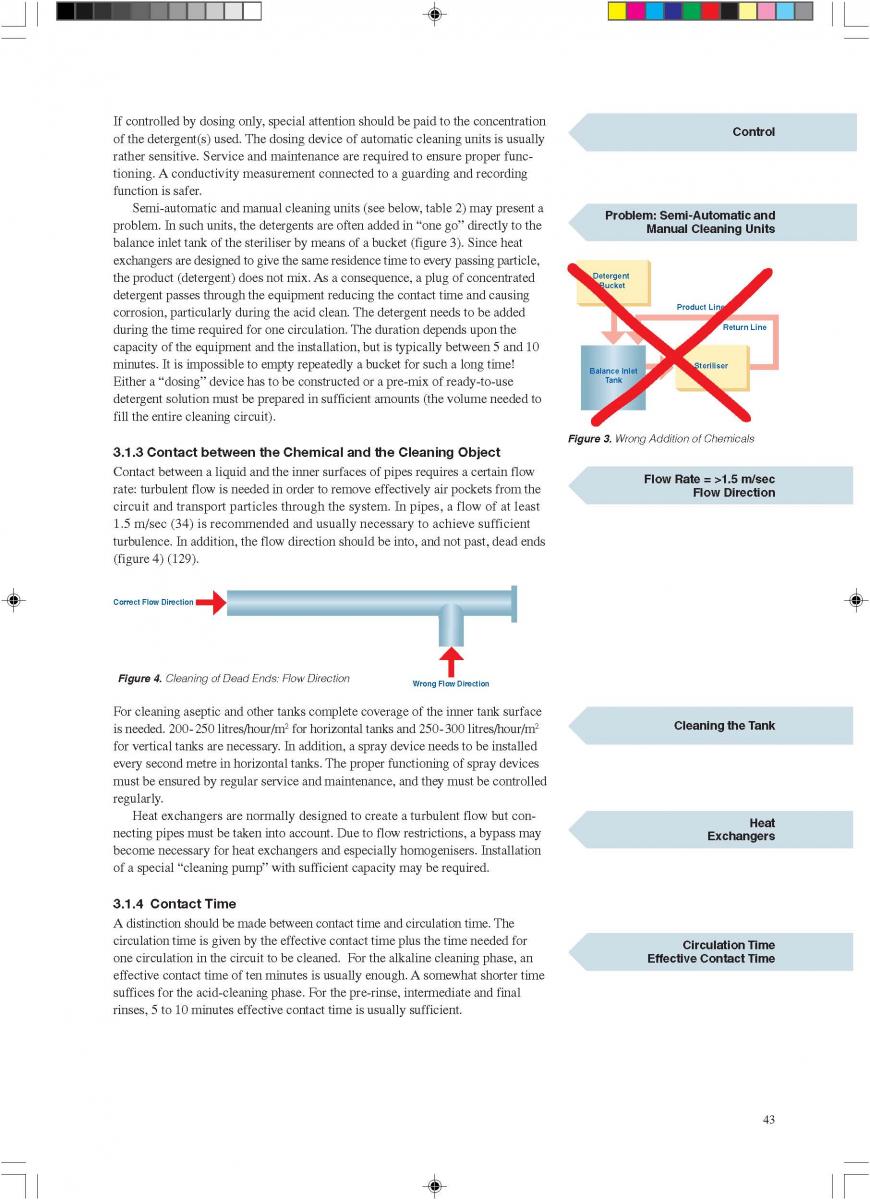
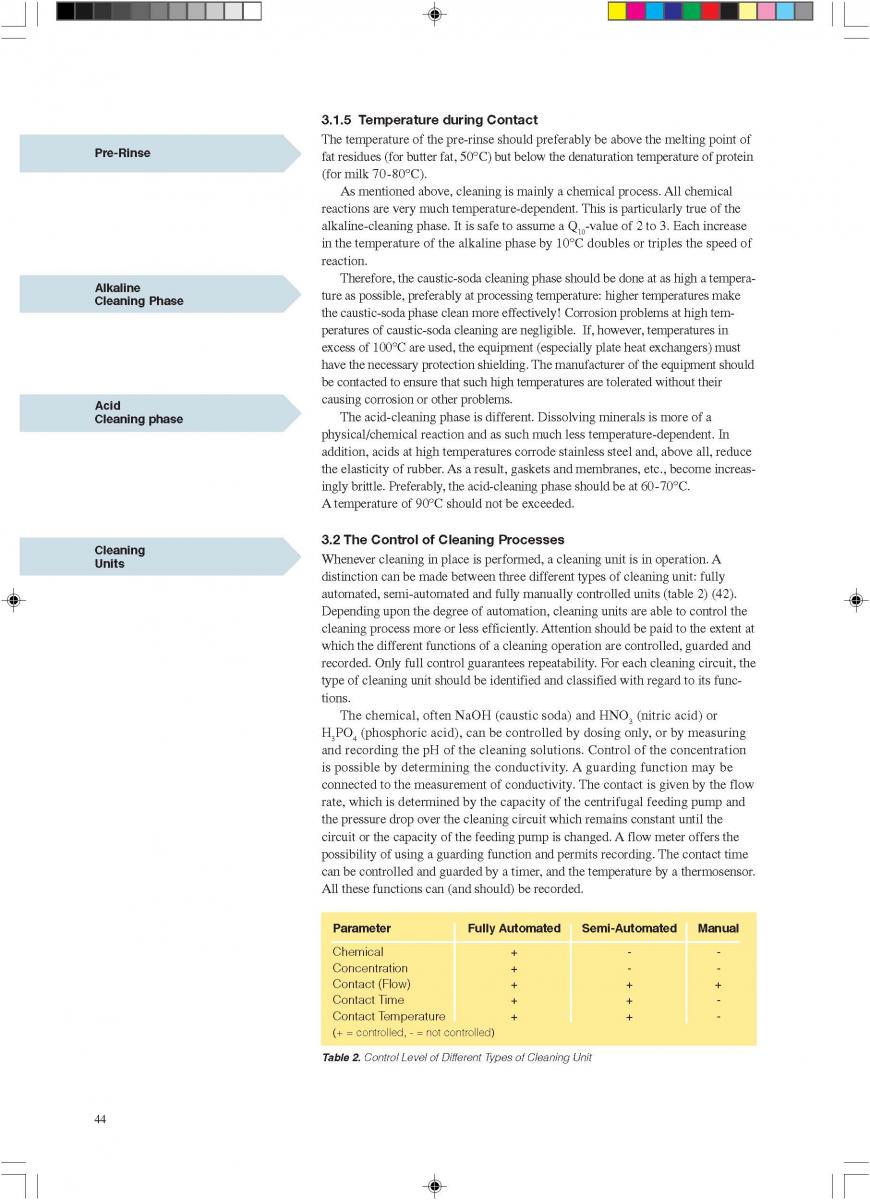
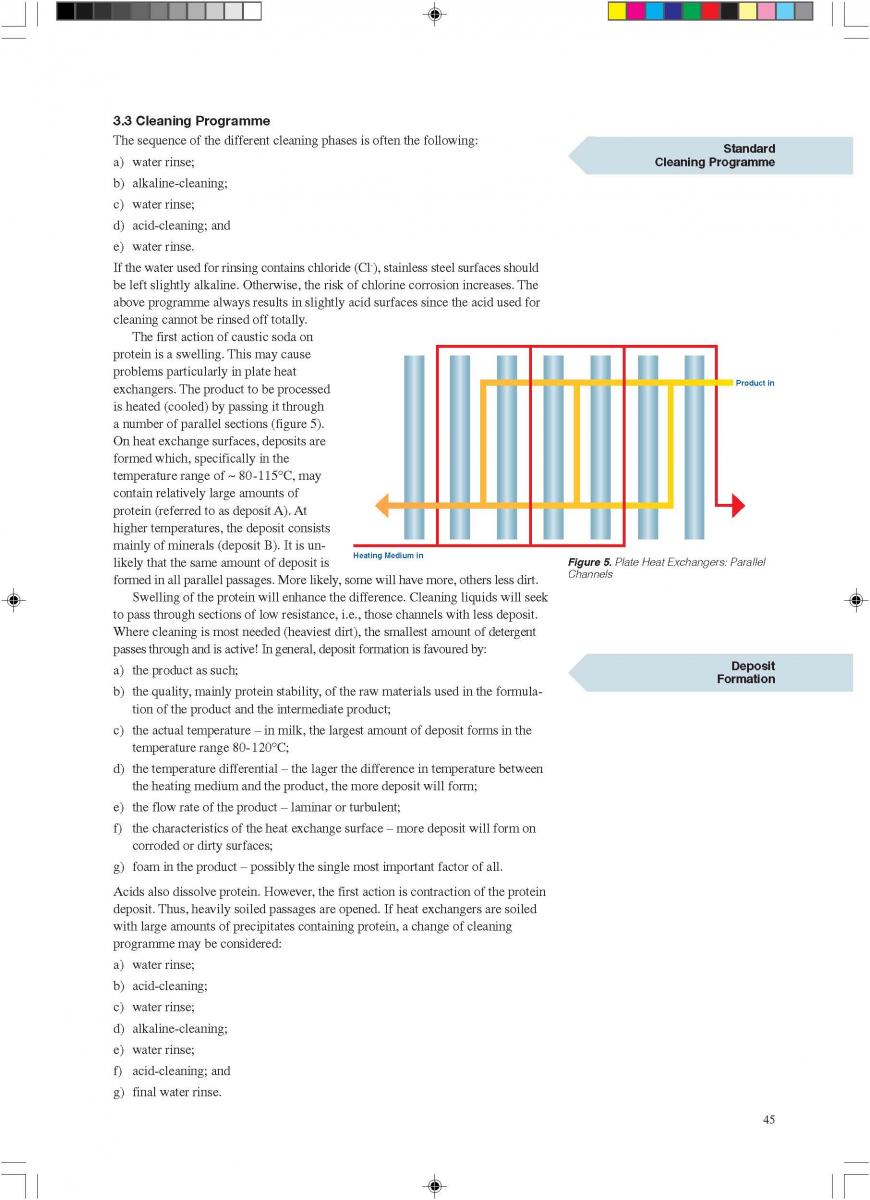
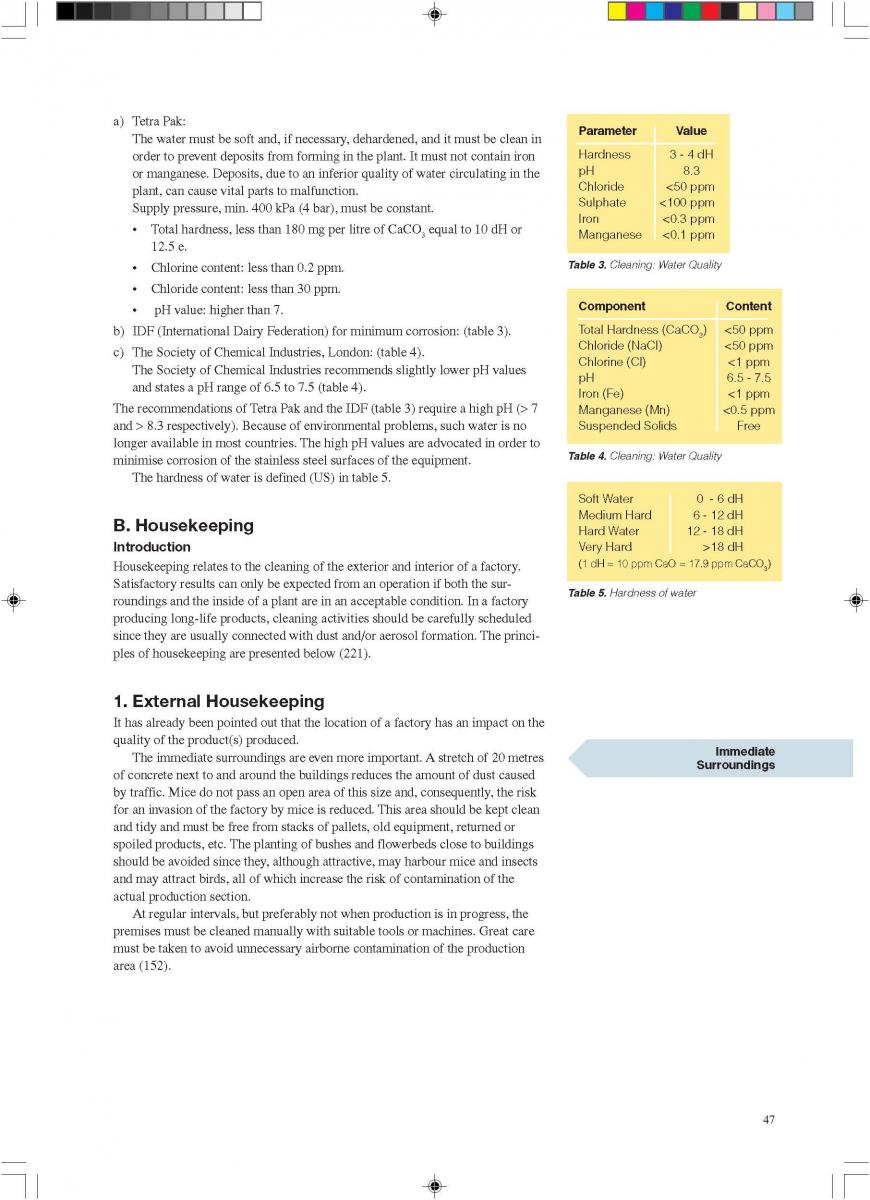
09. Commissioning
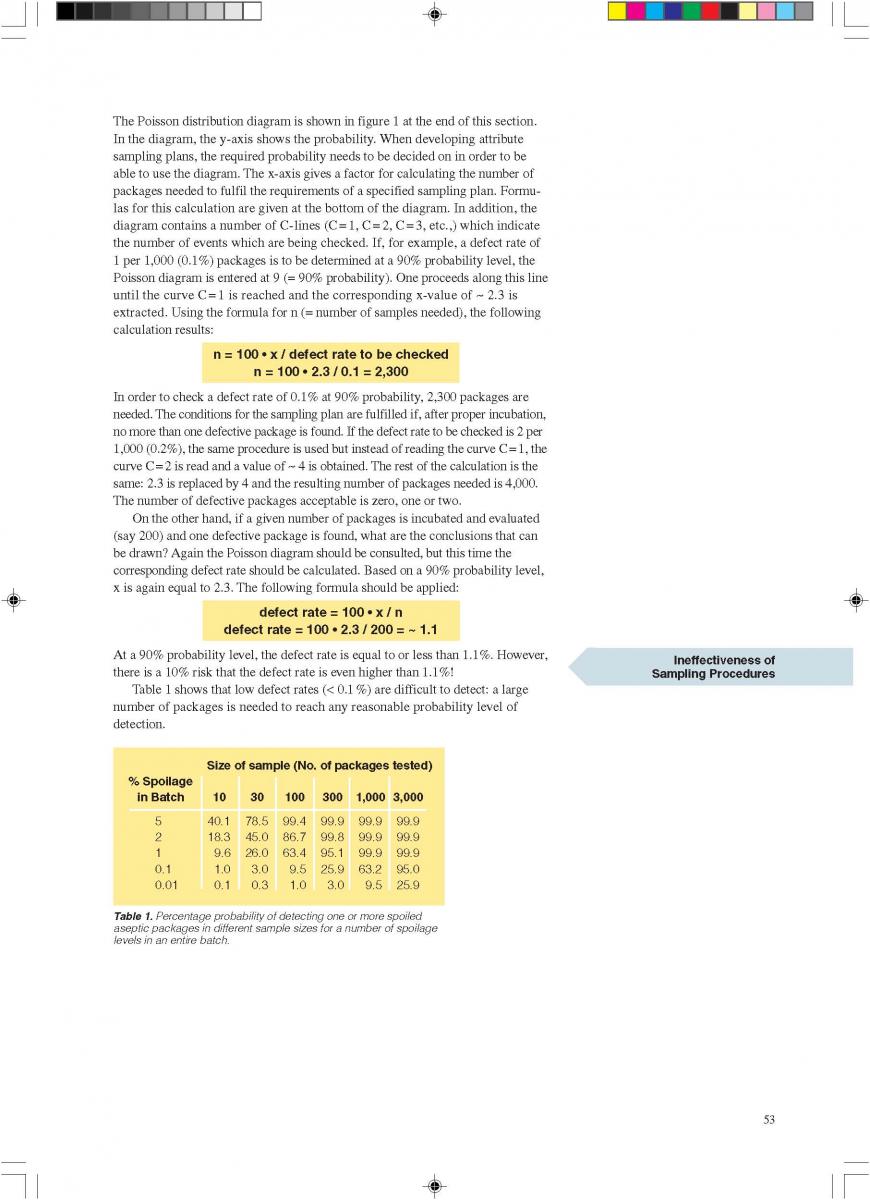
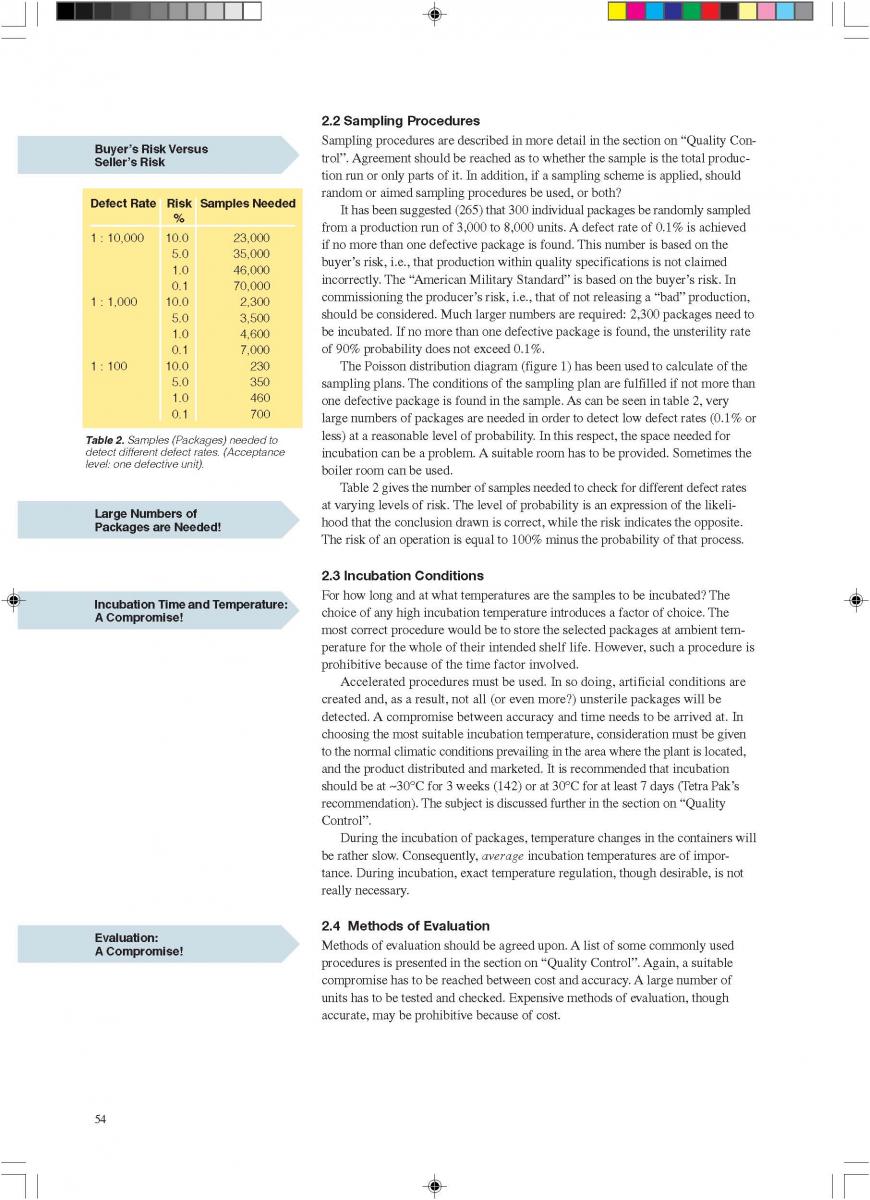
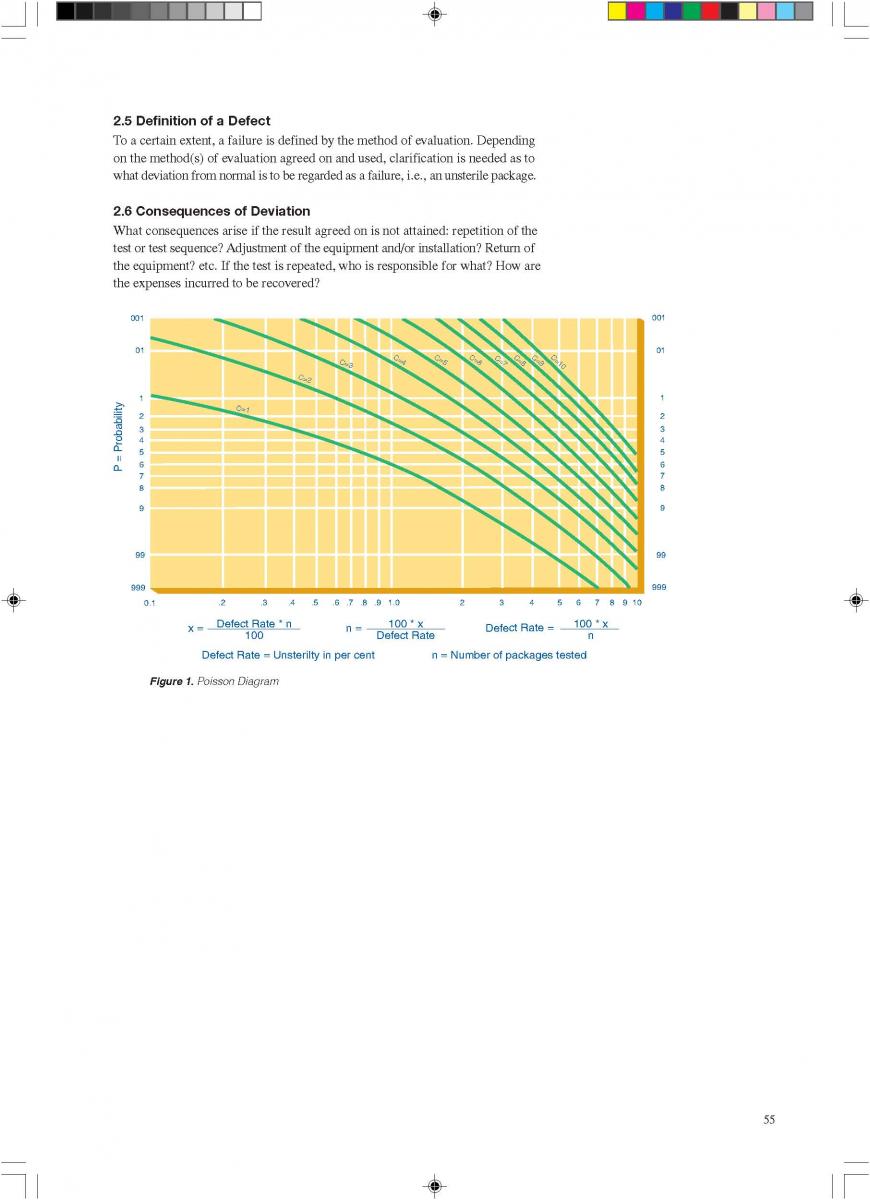
10. Changes during milk processing
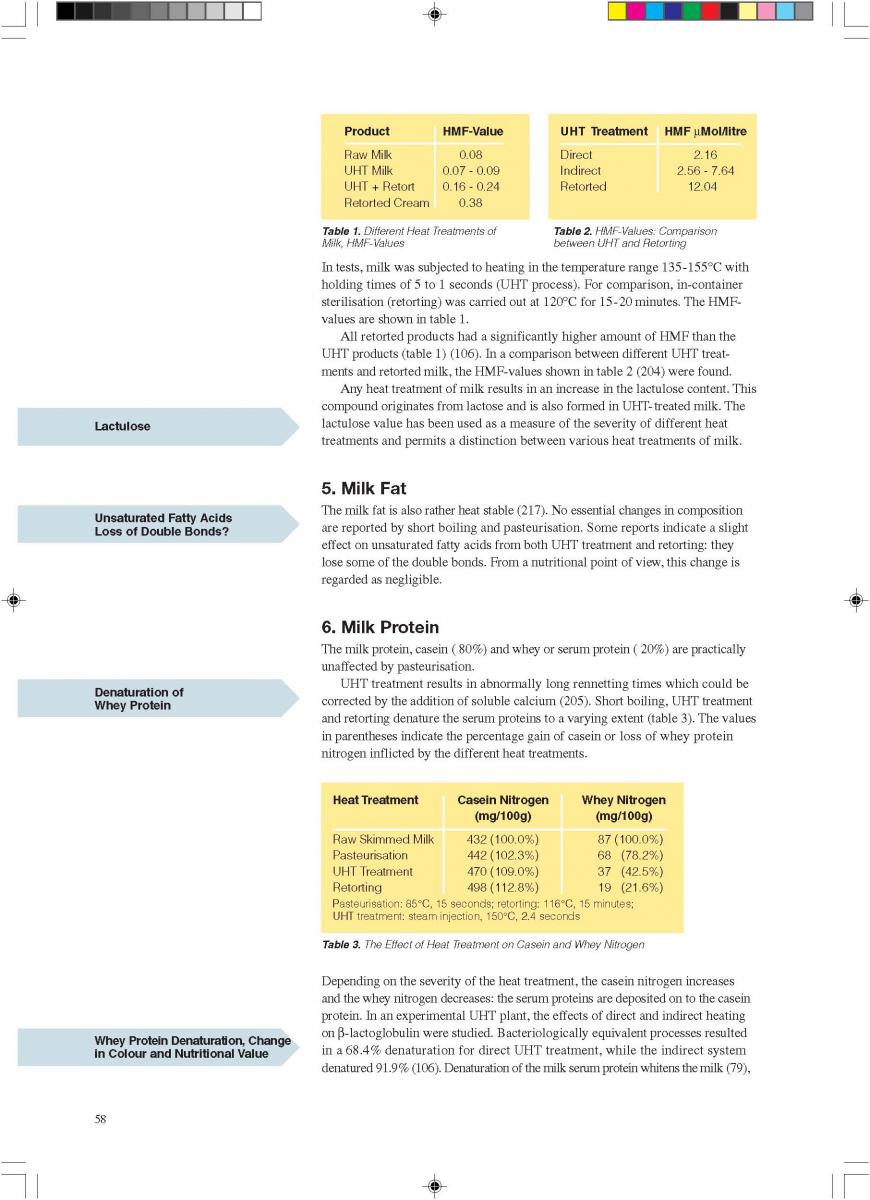
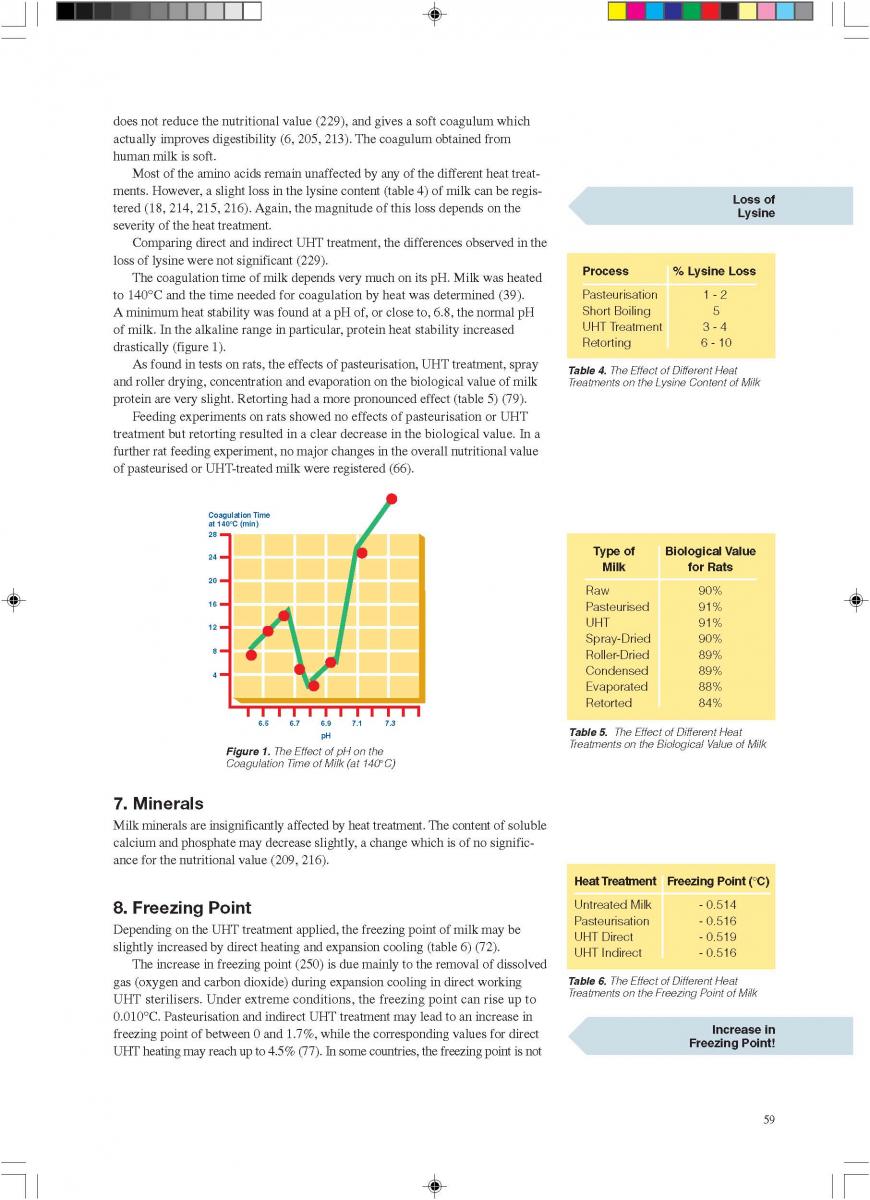
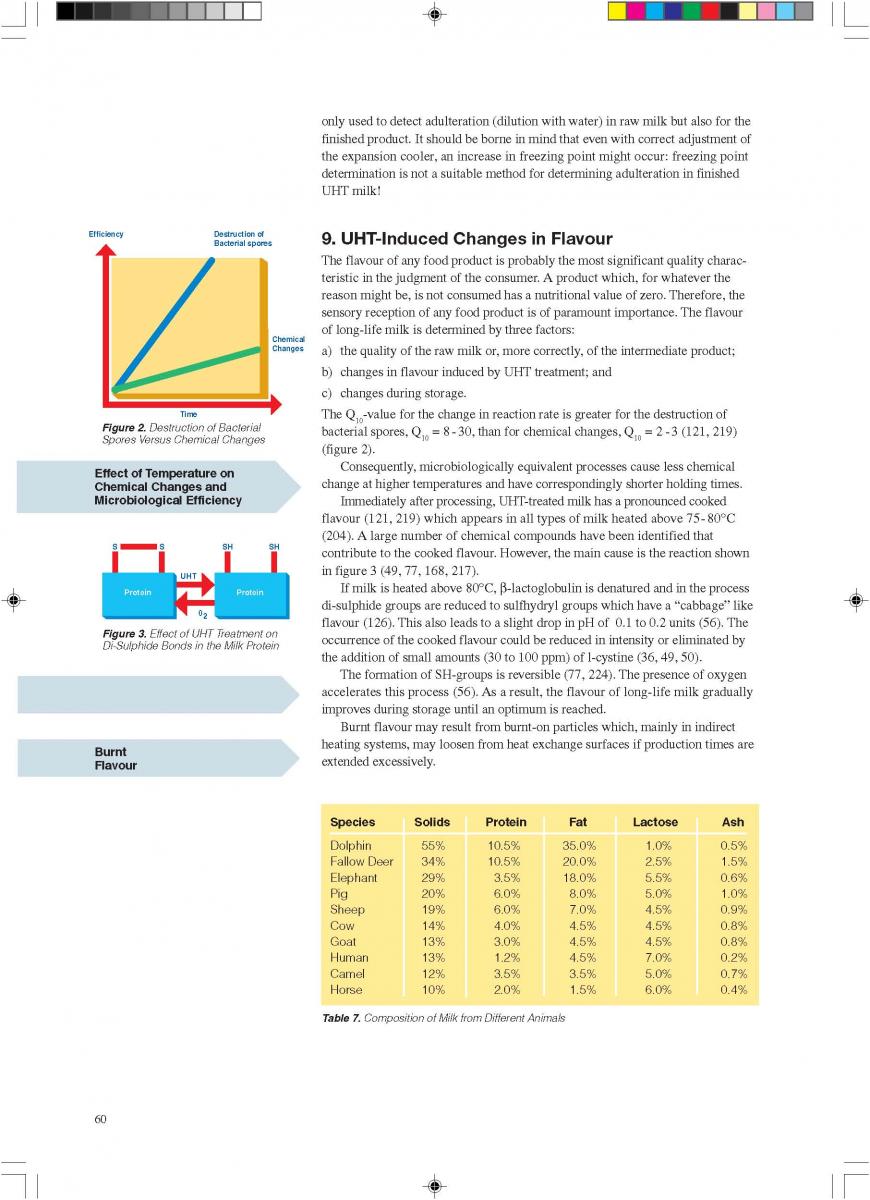
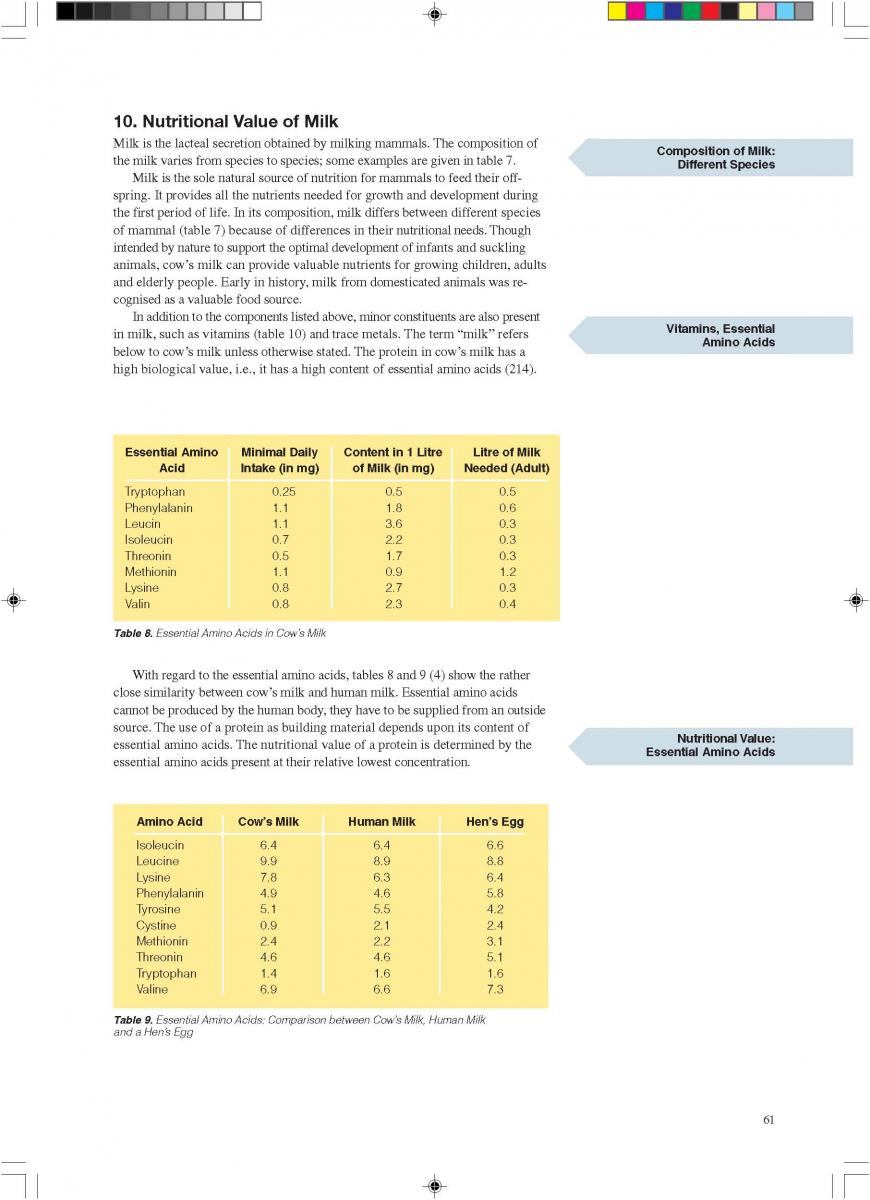
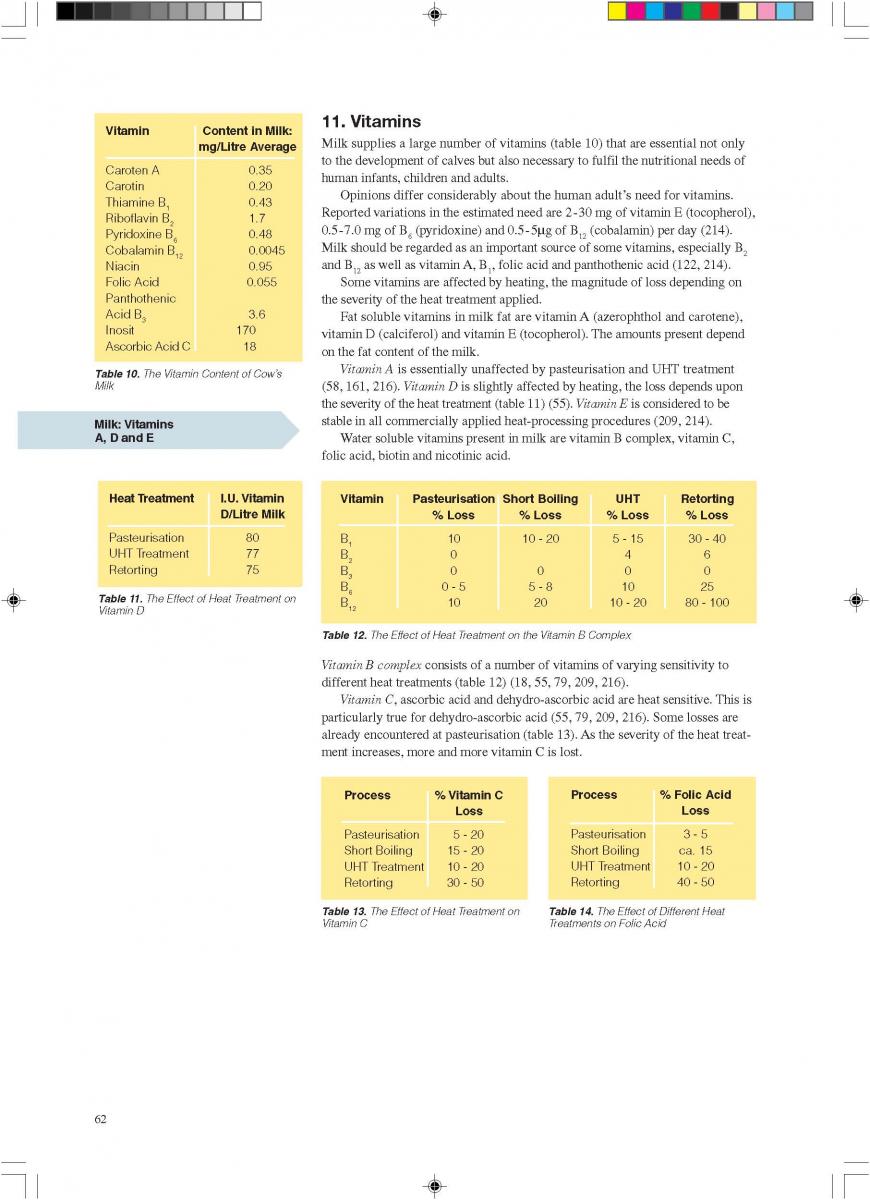
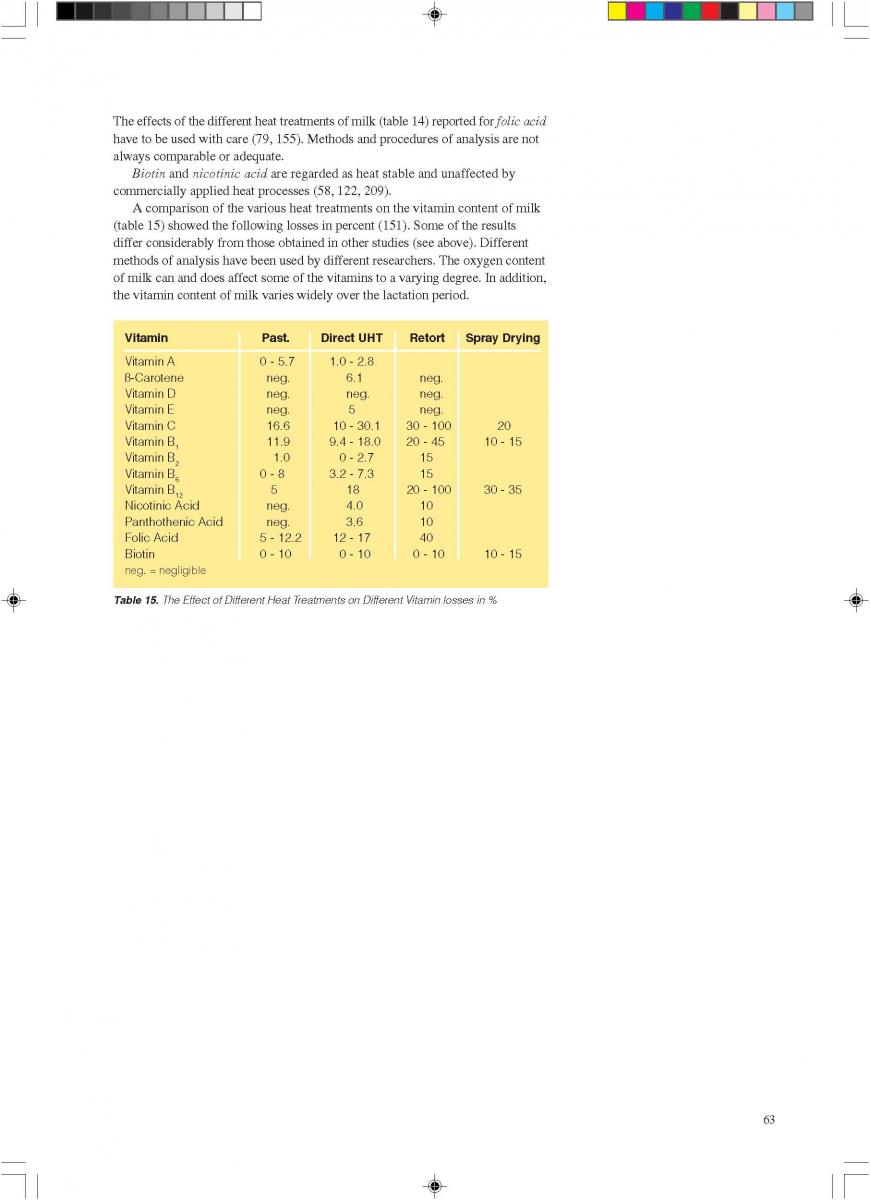
11. Product changes during storage
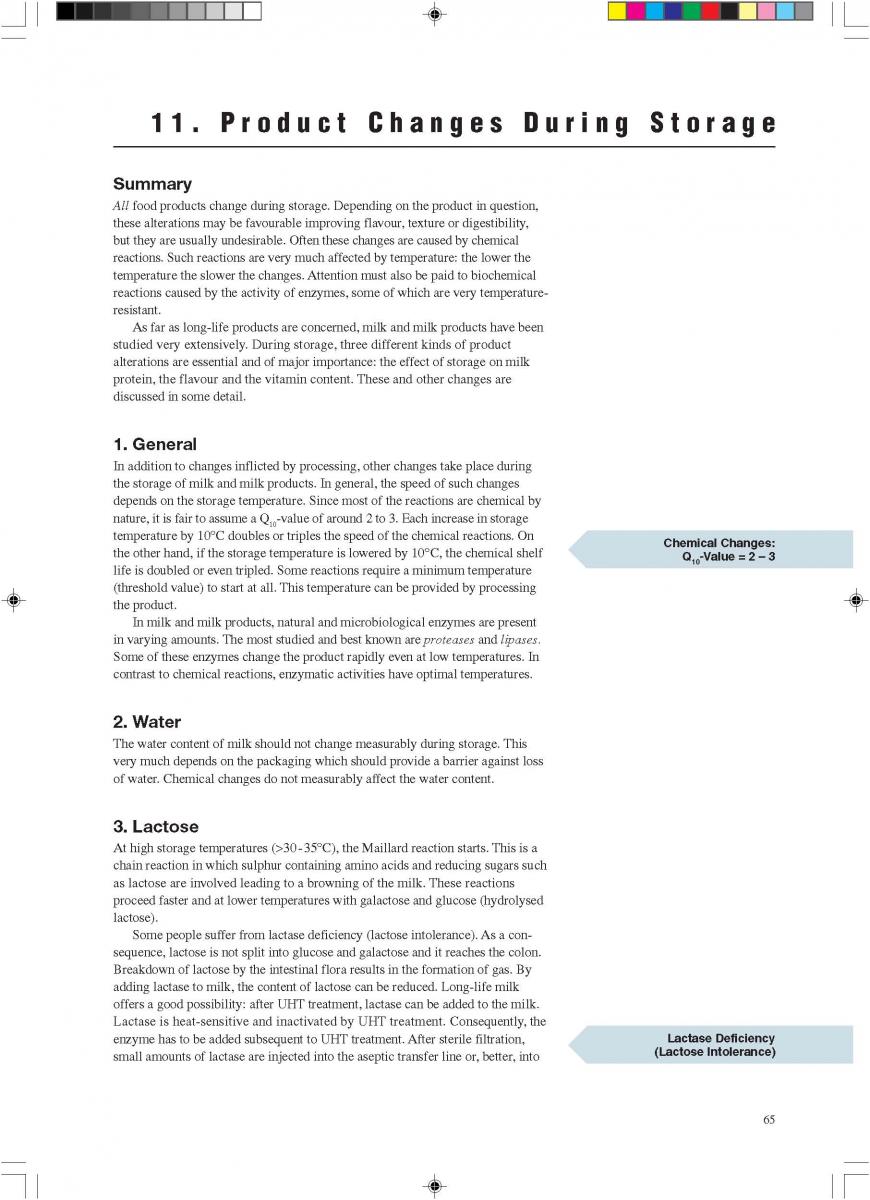
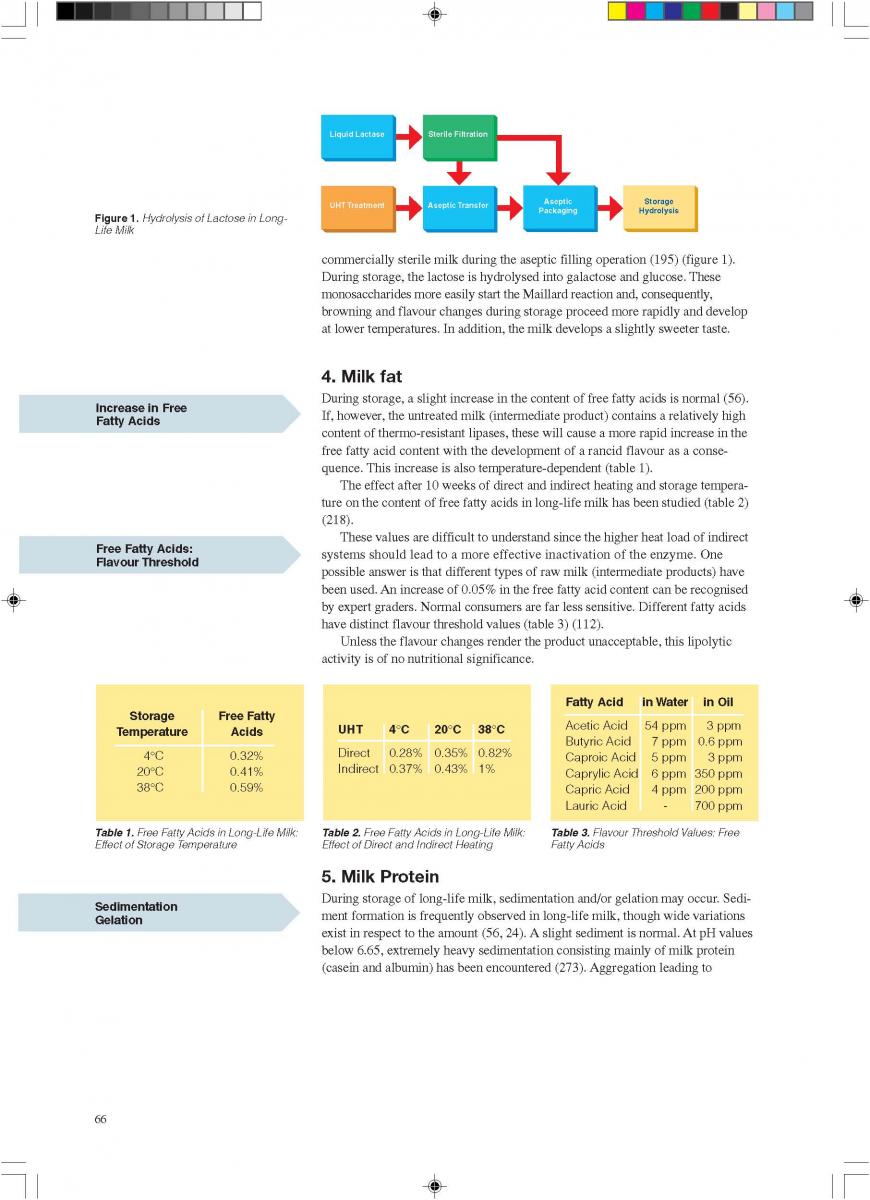
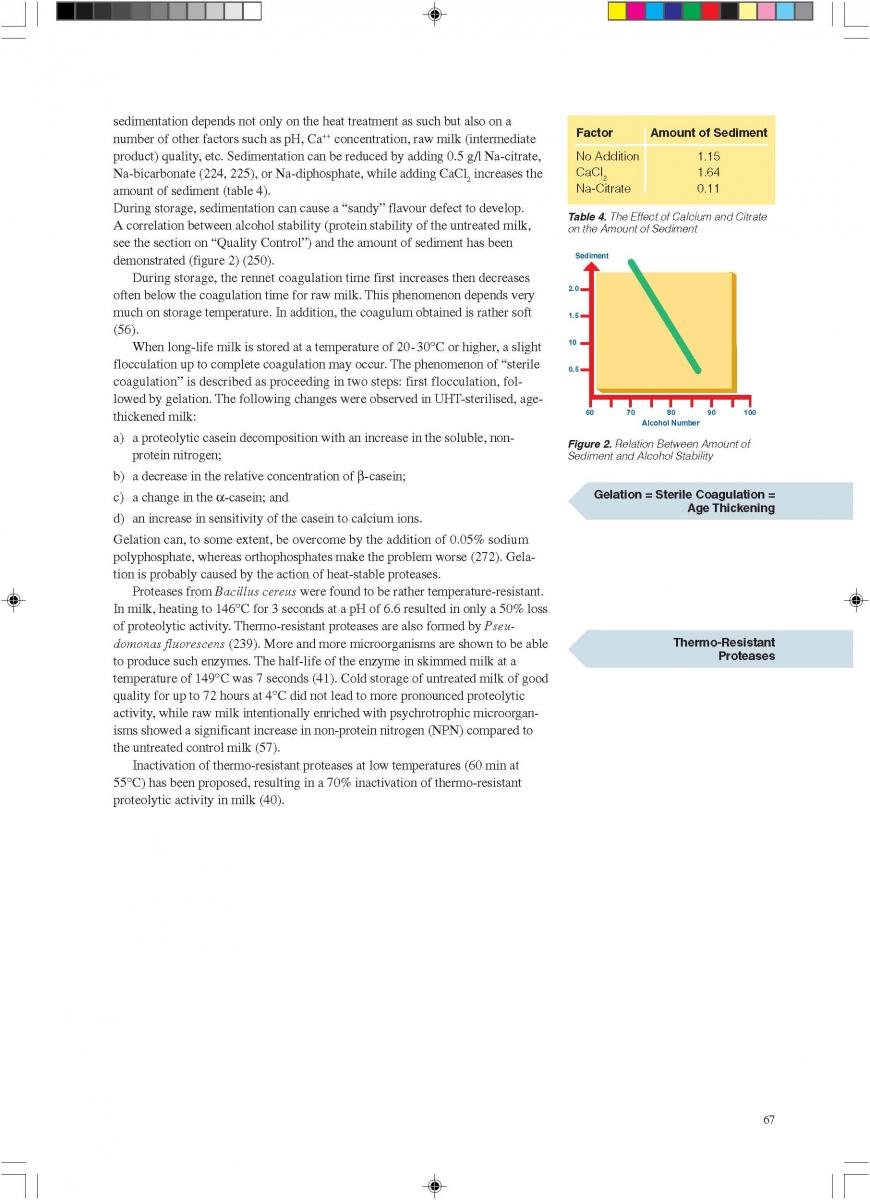
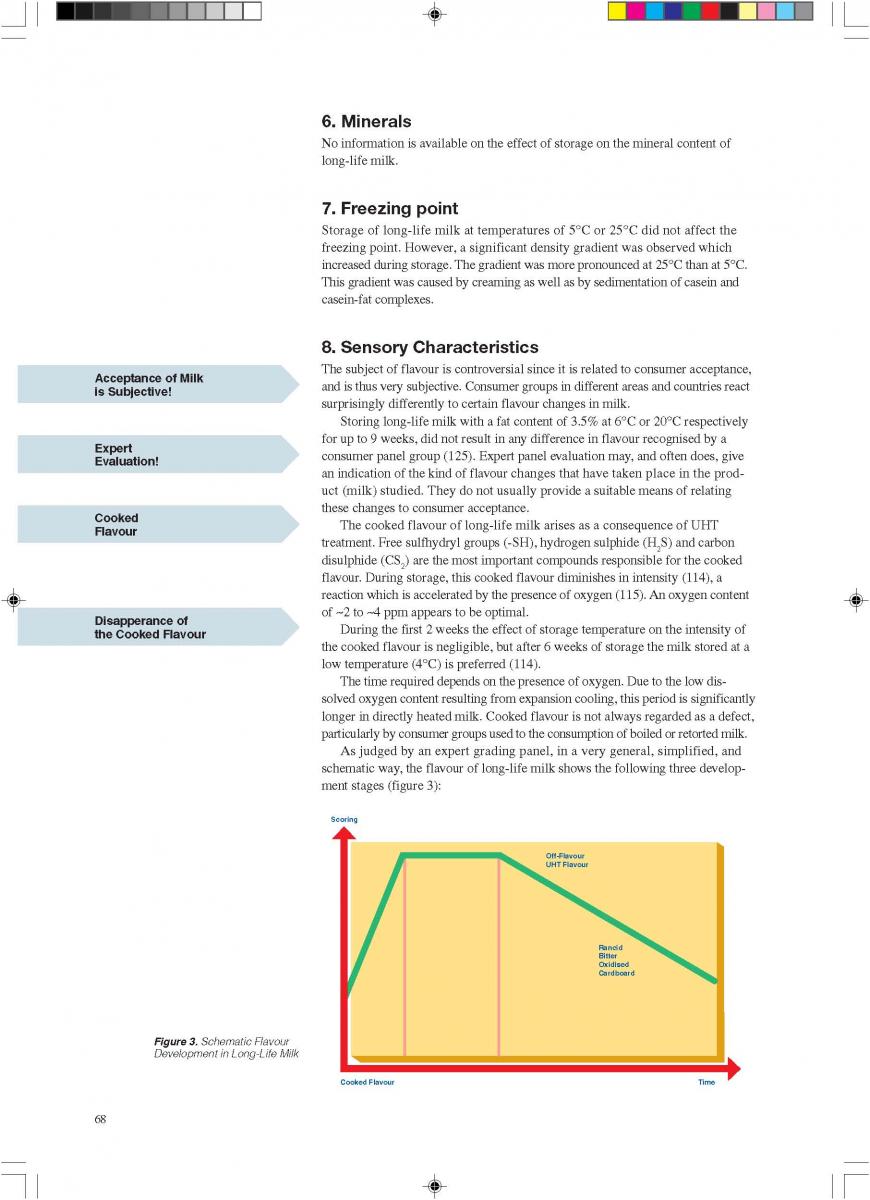
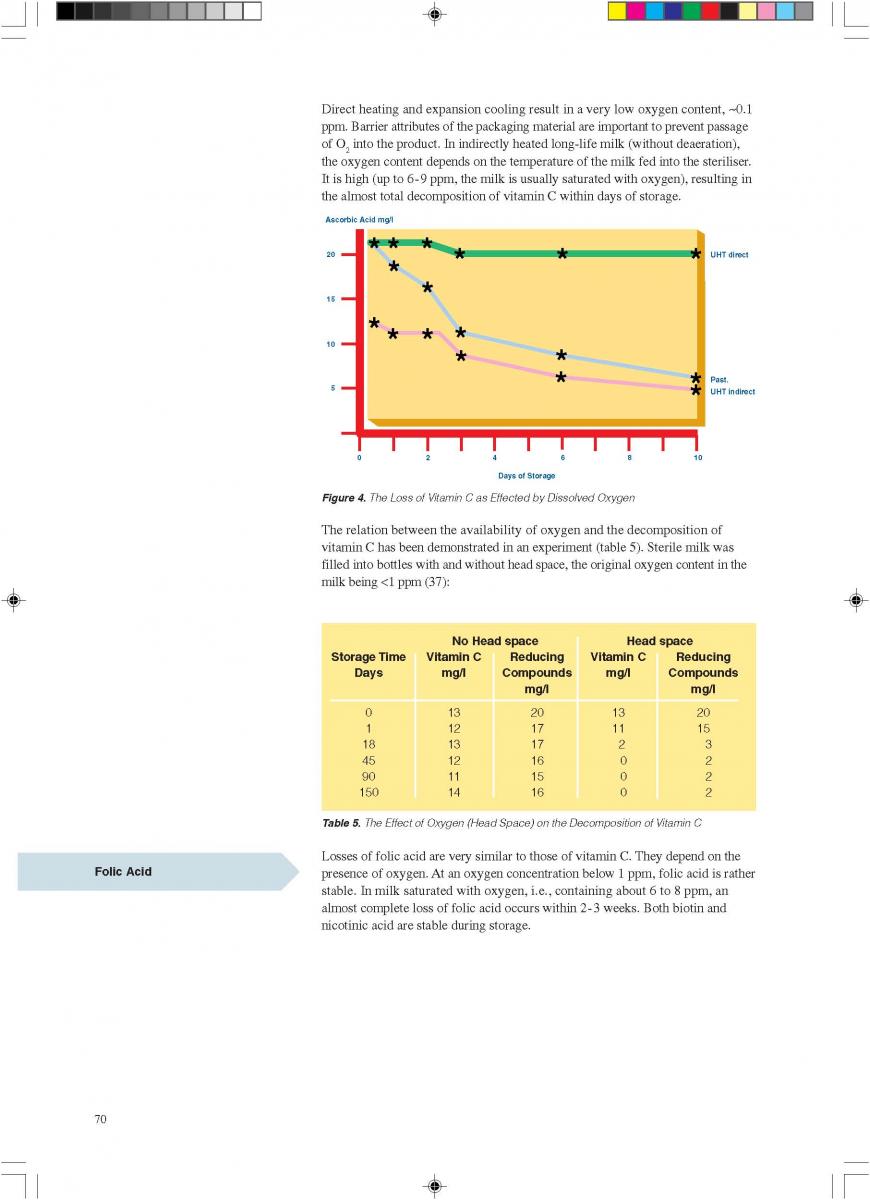
12. Quality control of aseptic product-Part1
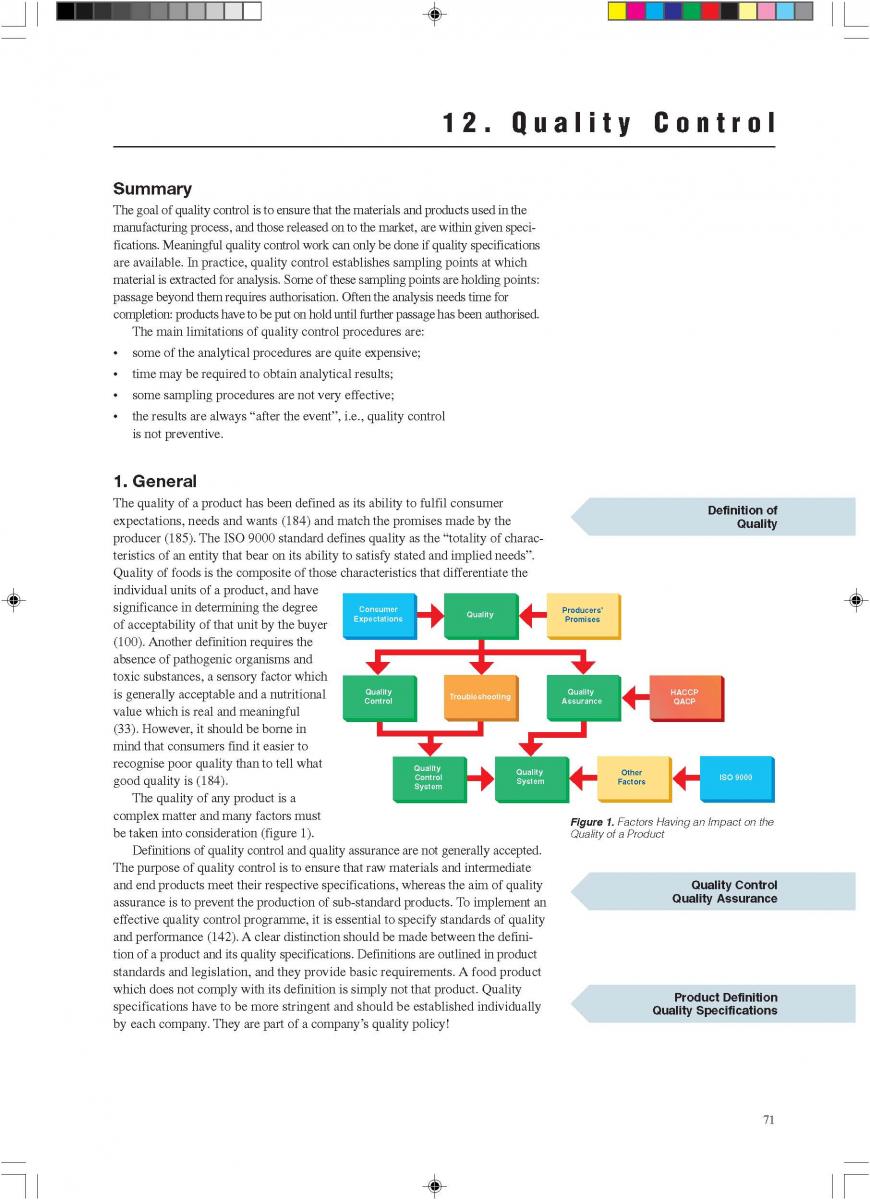
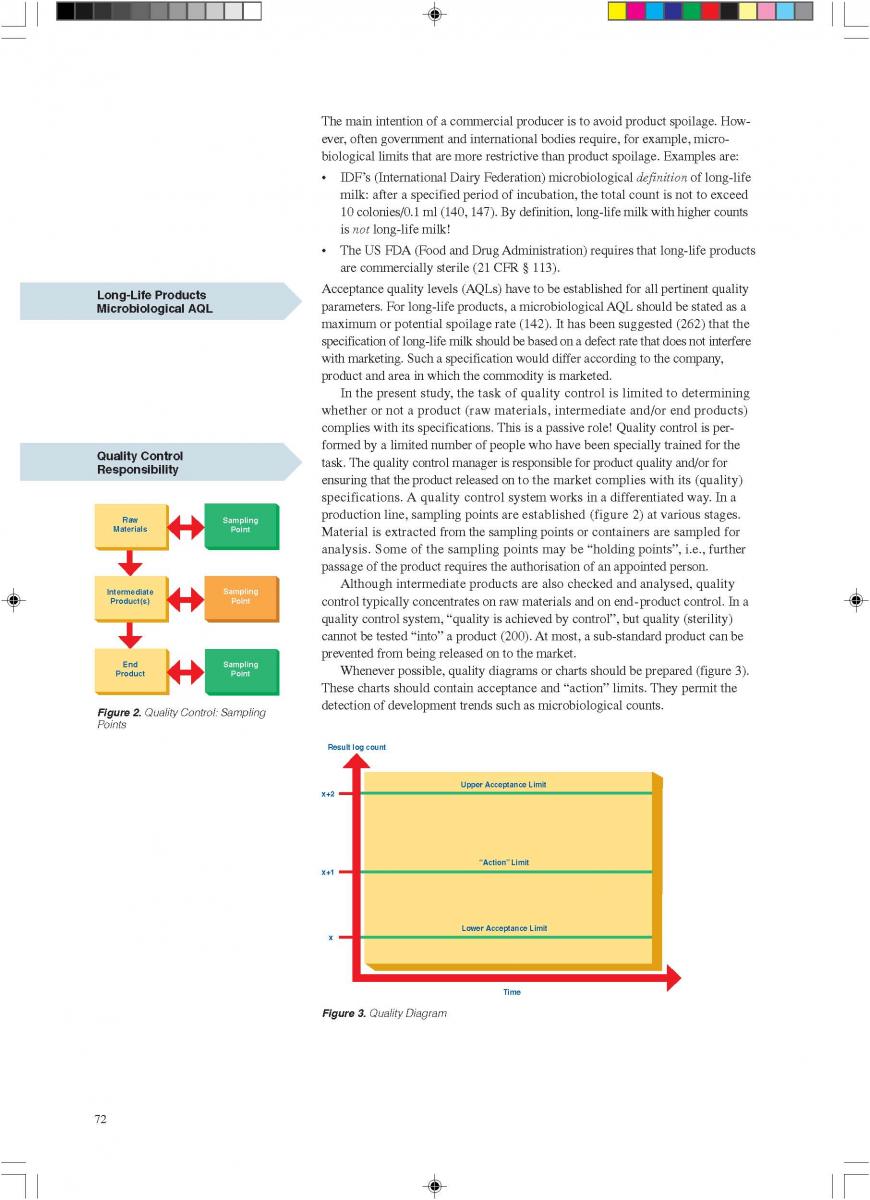
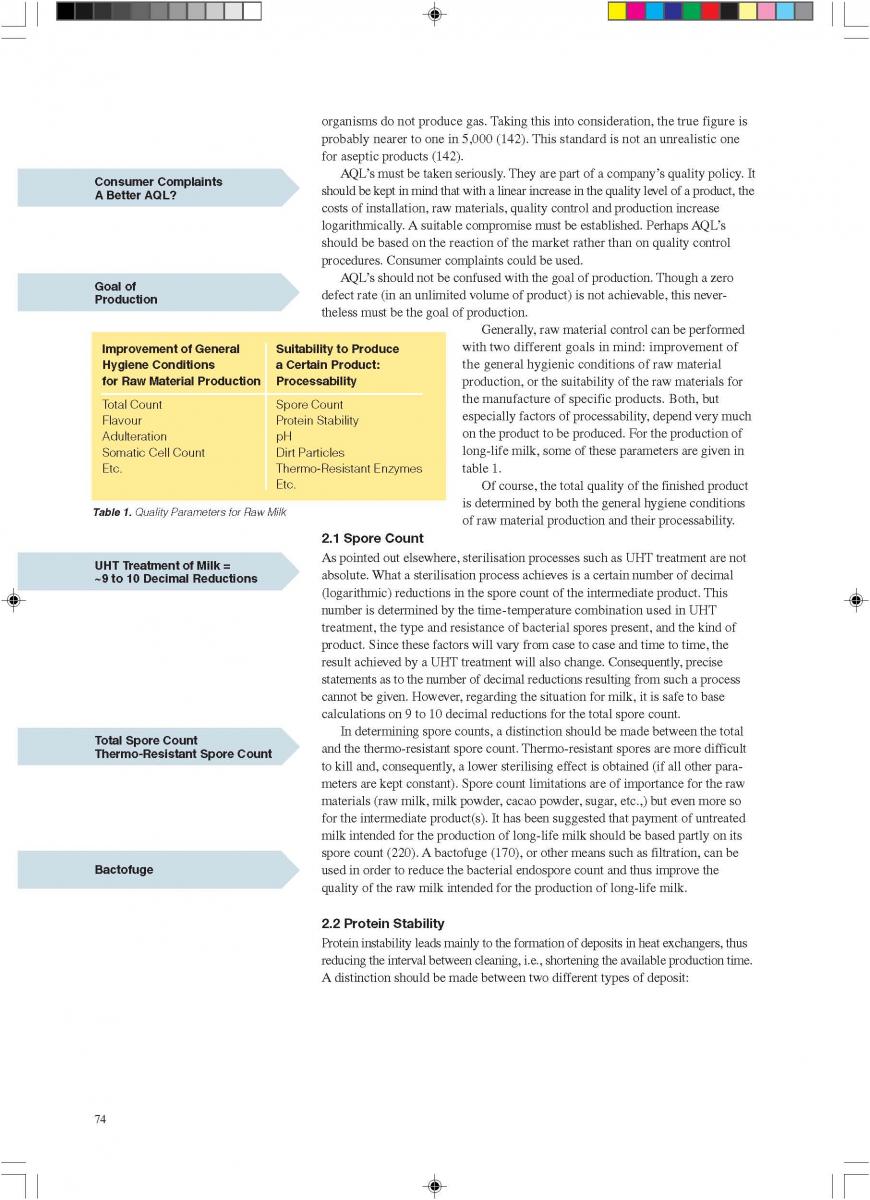
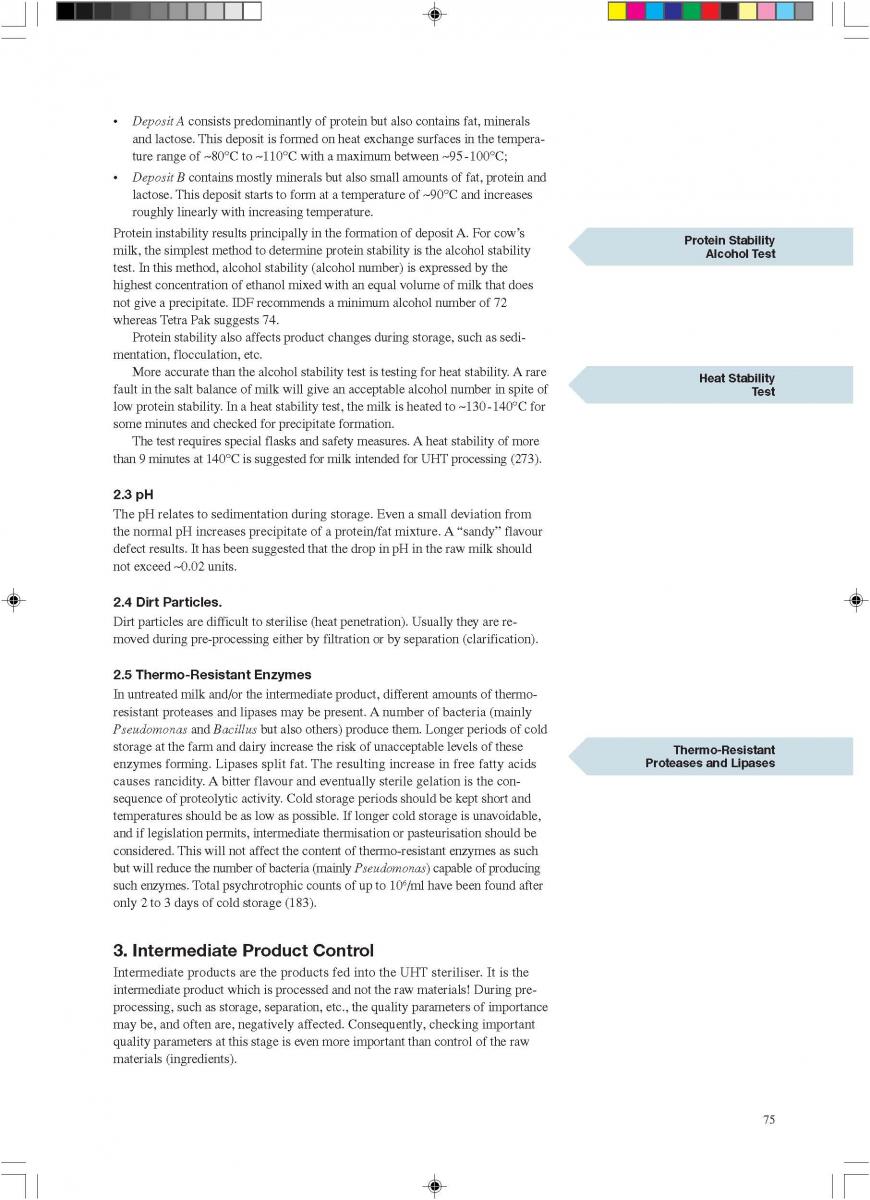
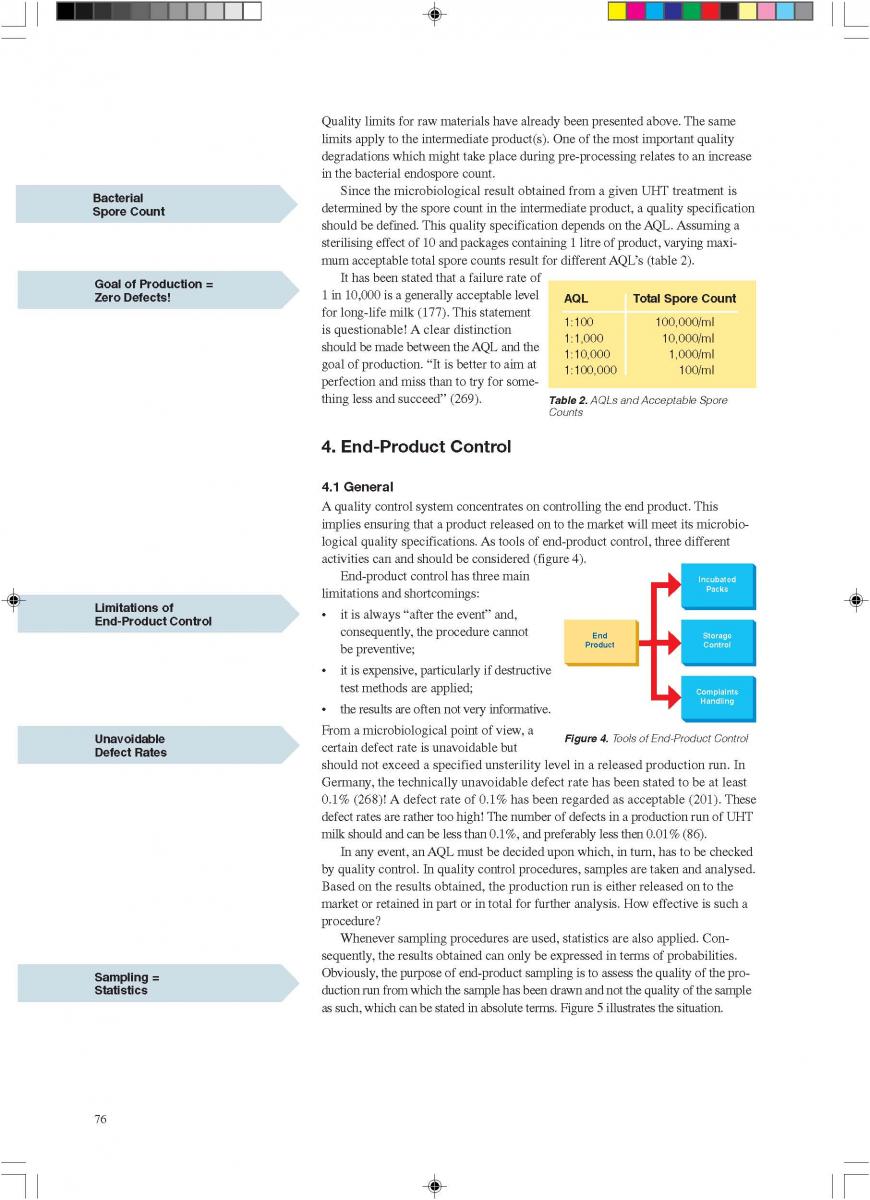
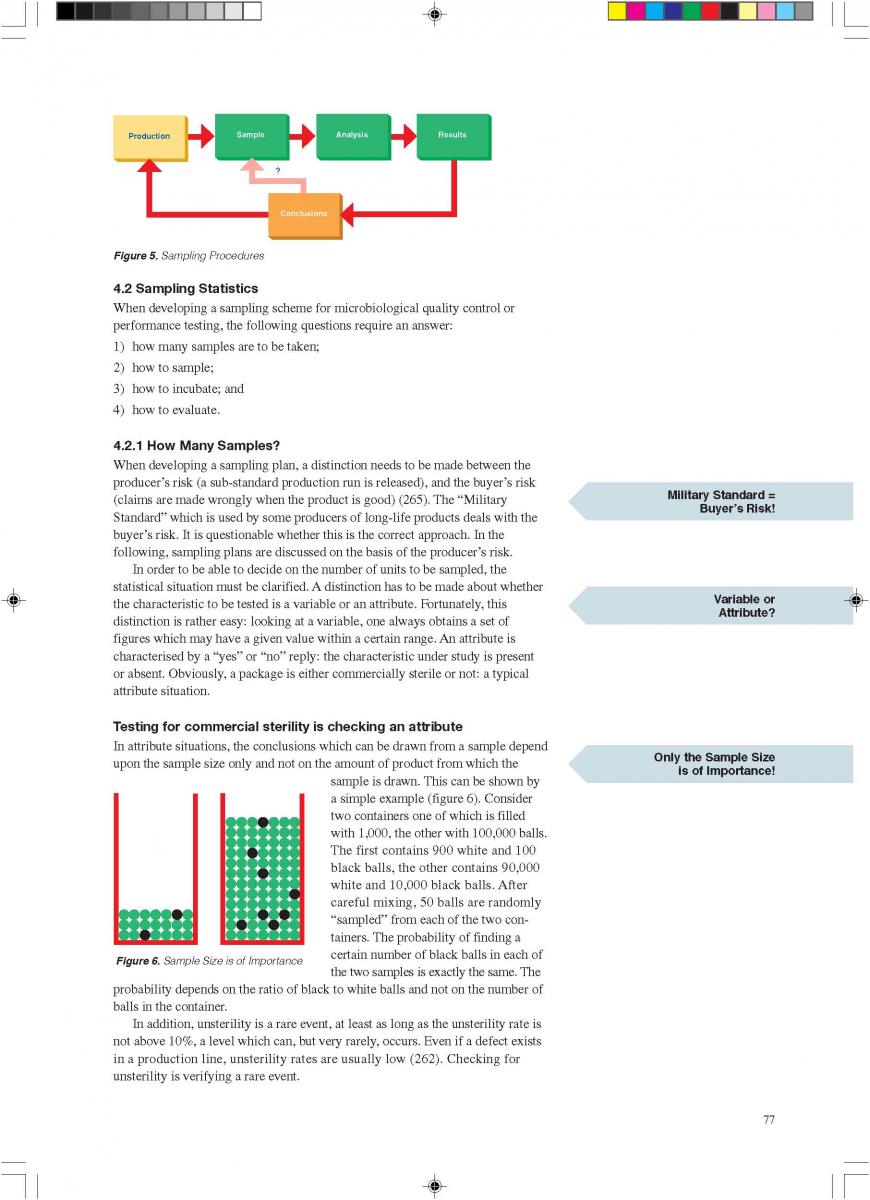
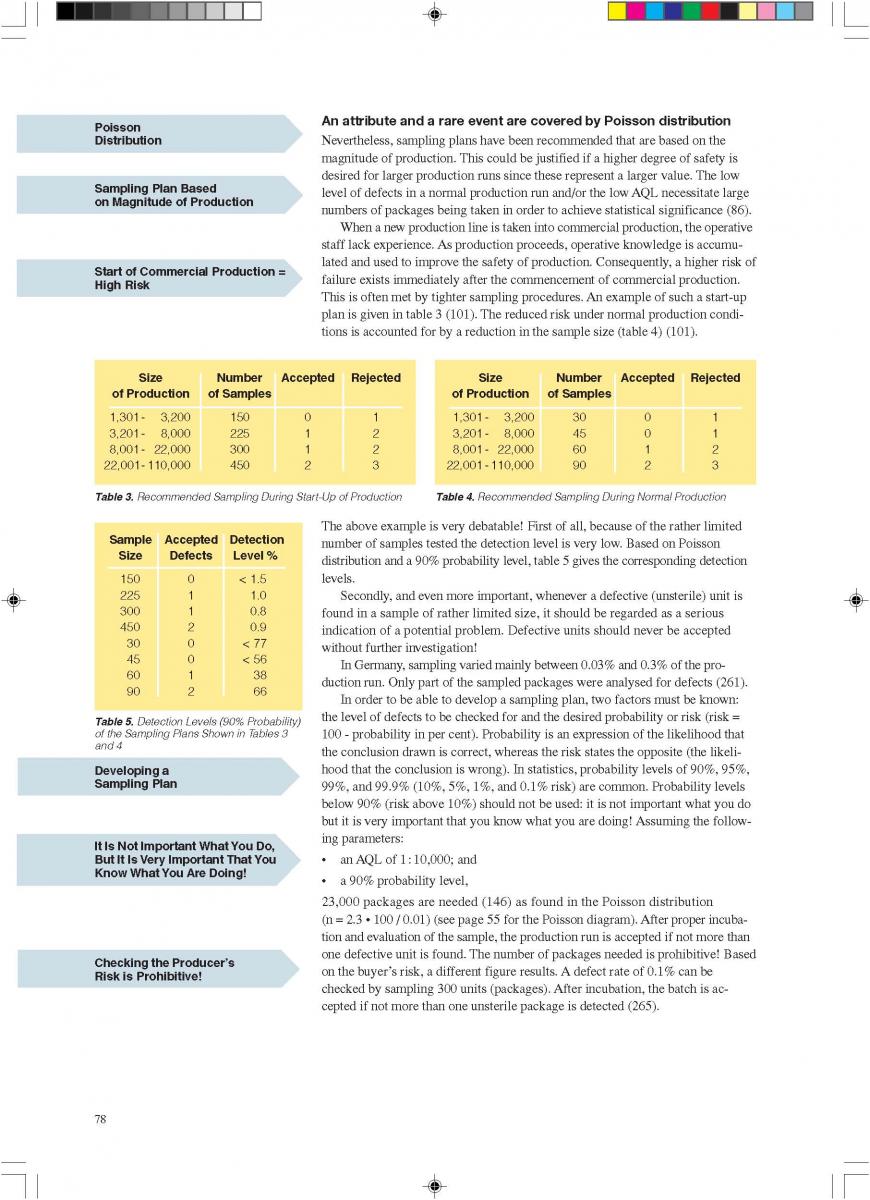
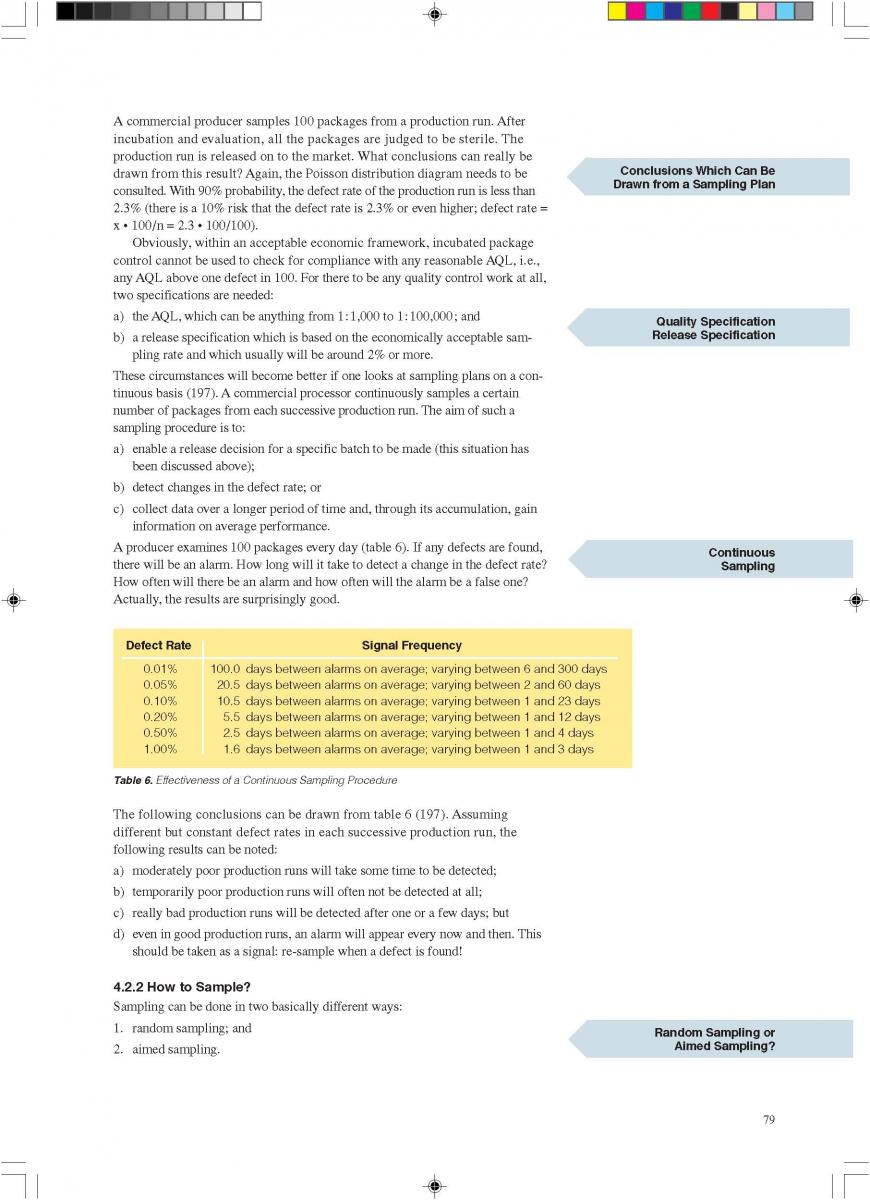
12. Quality control of aseptic product-Part2
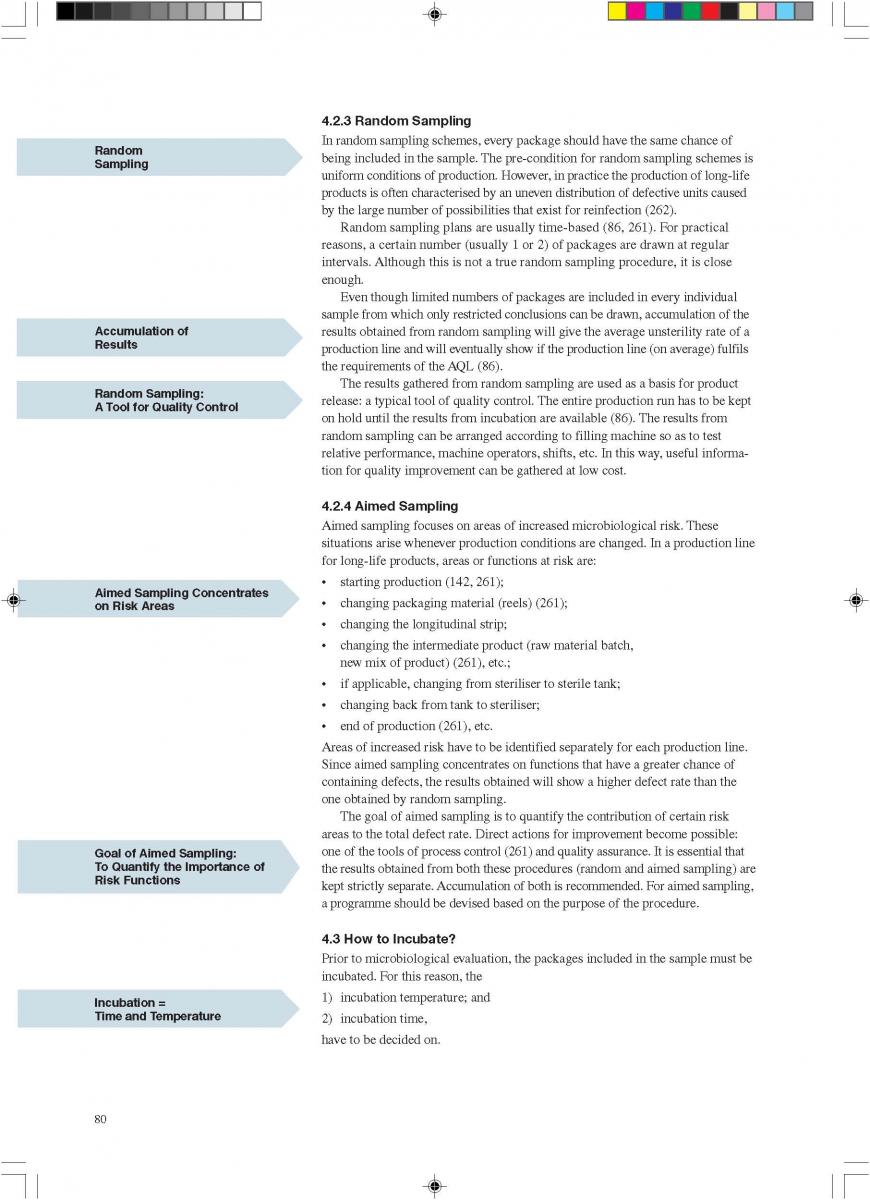
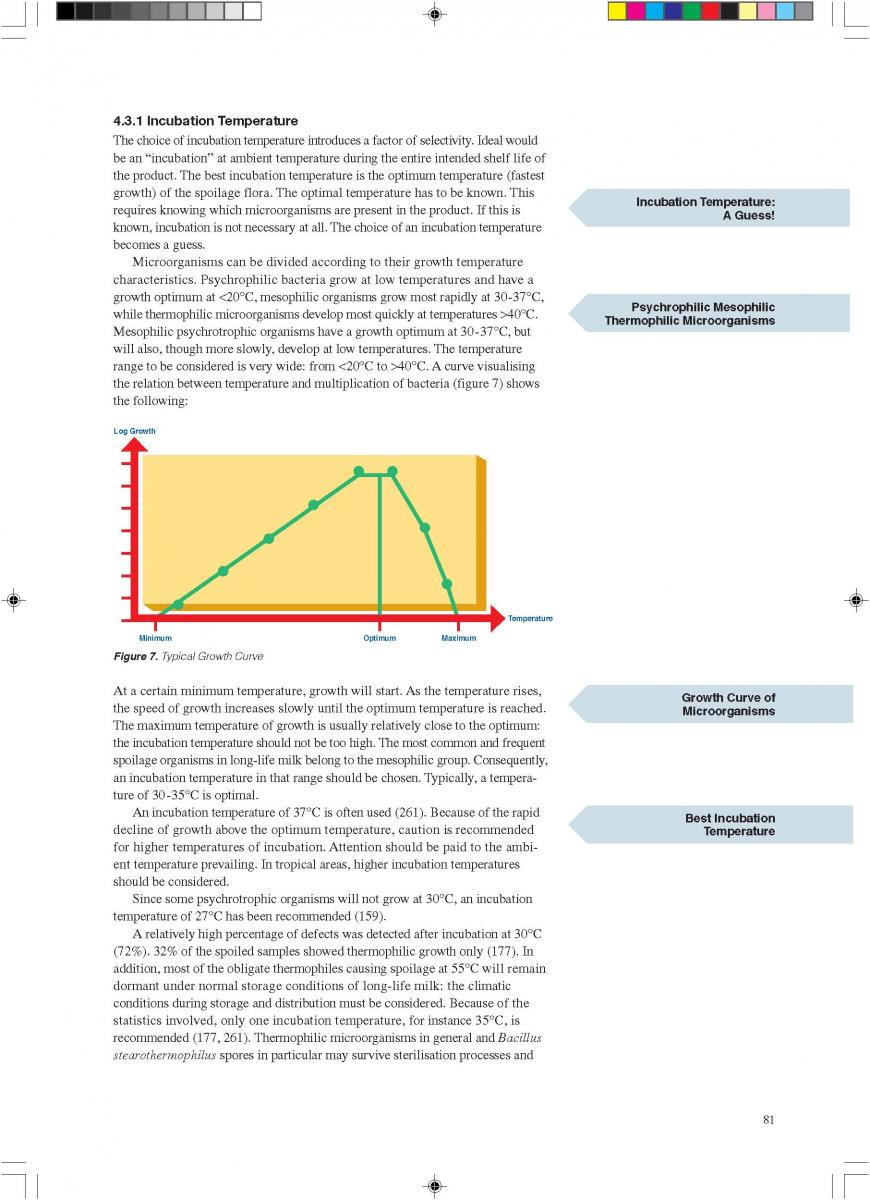
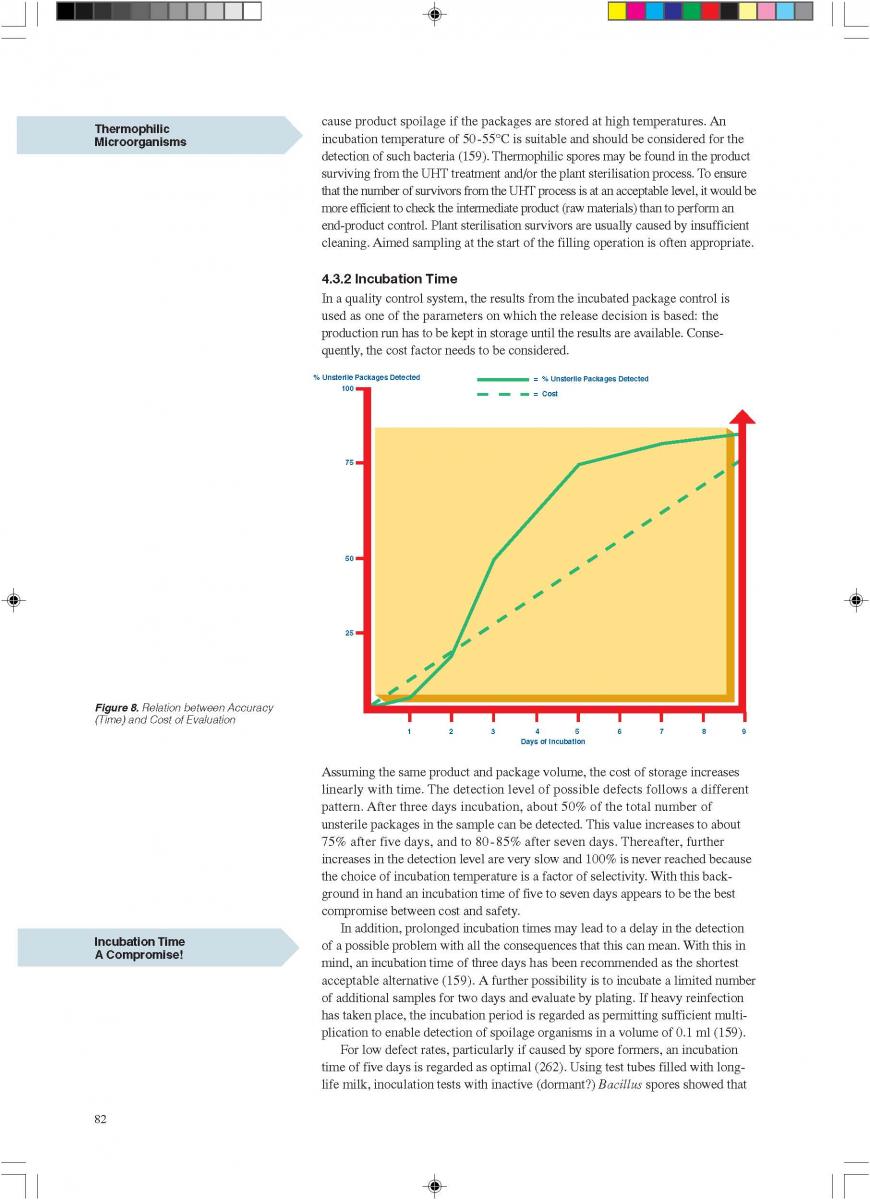
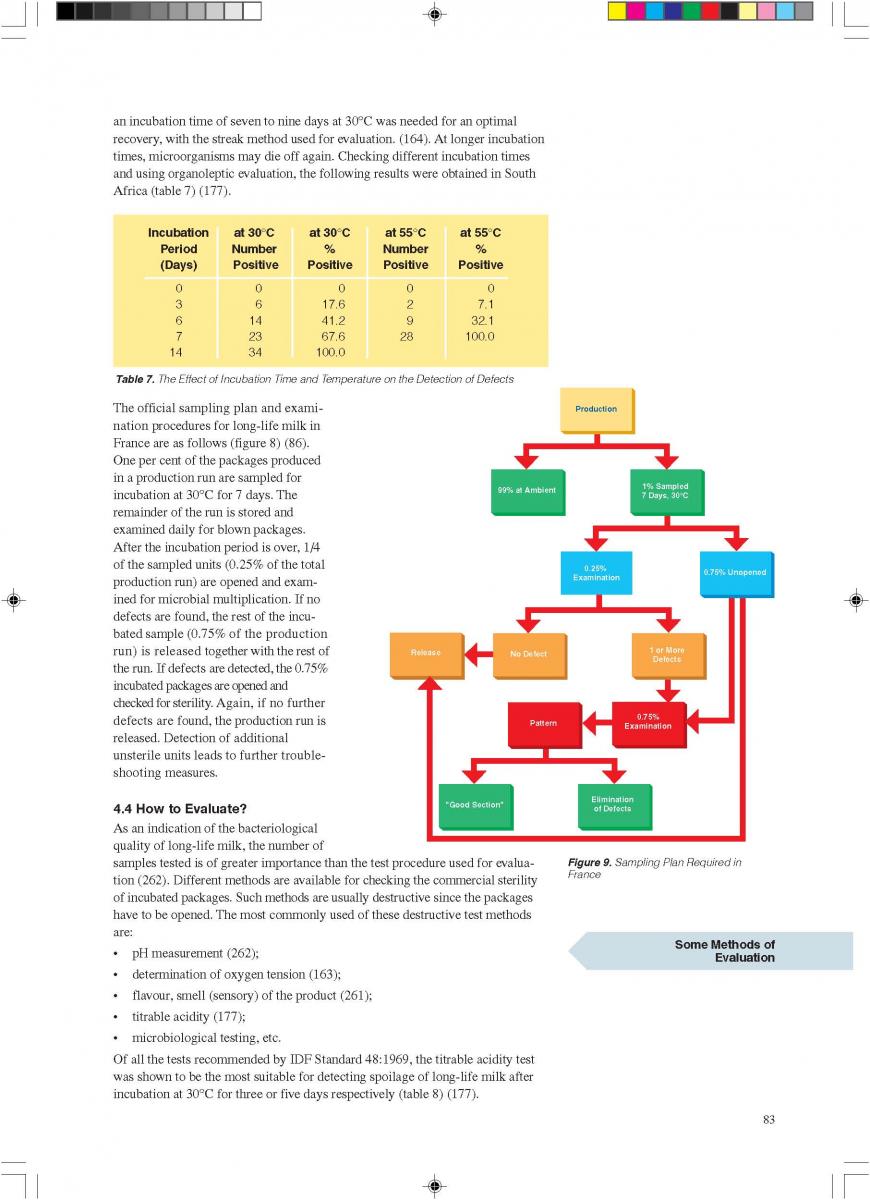
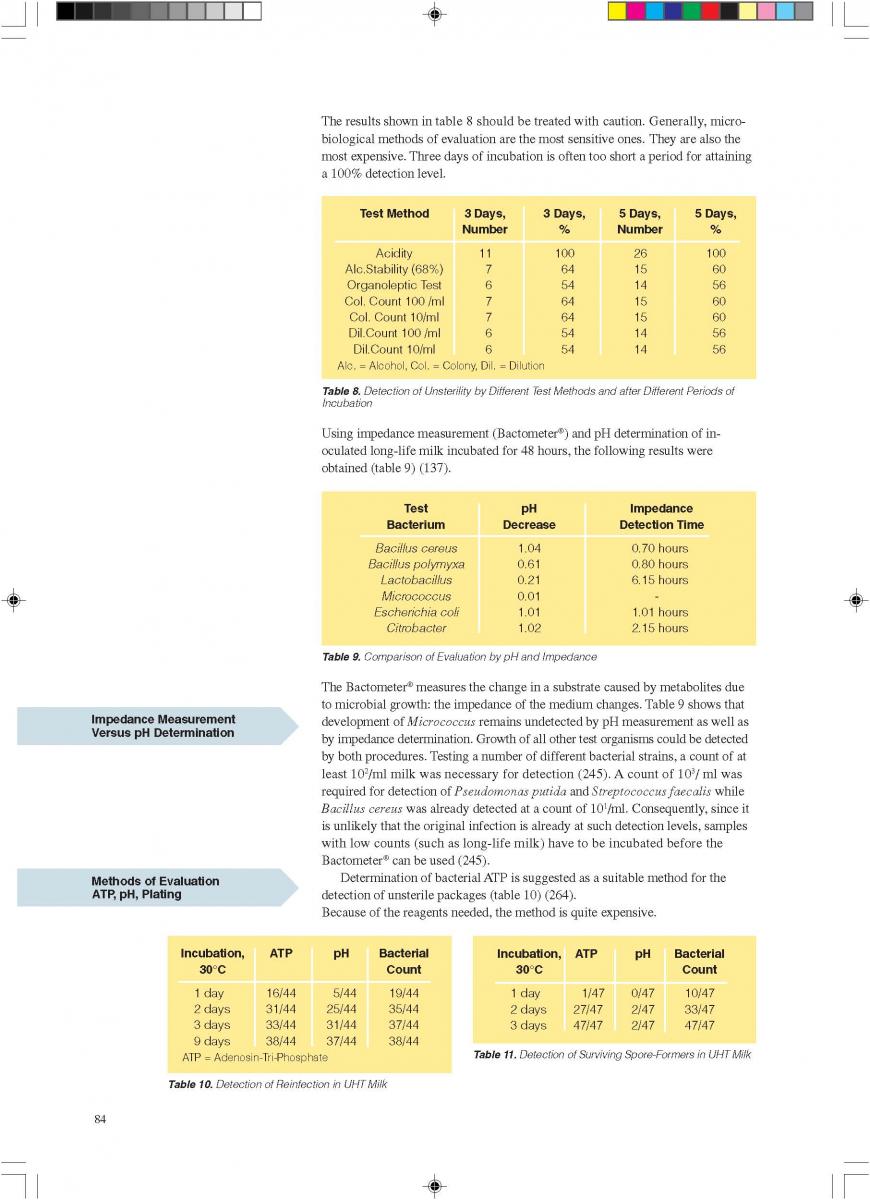
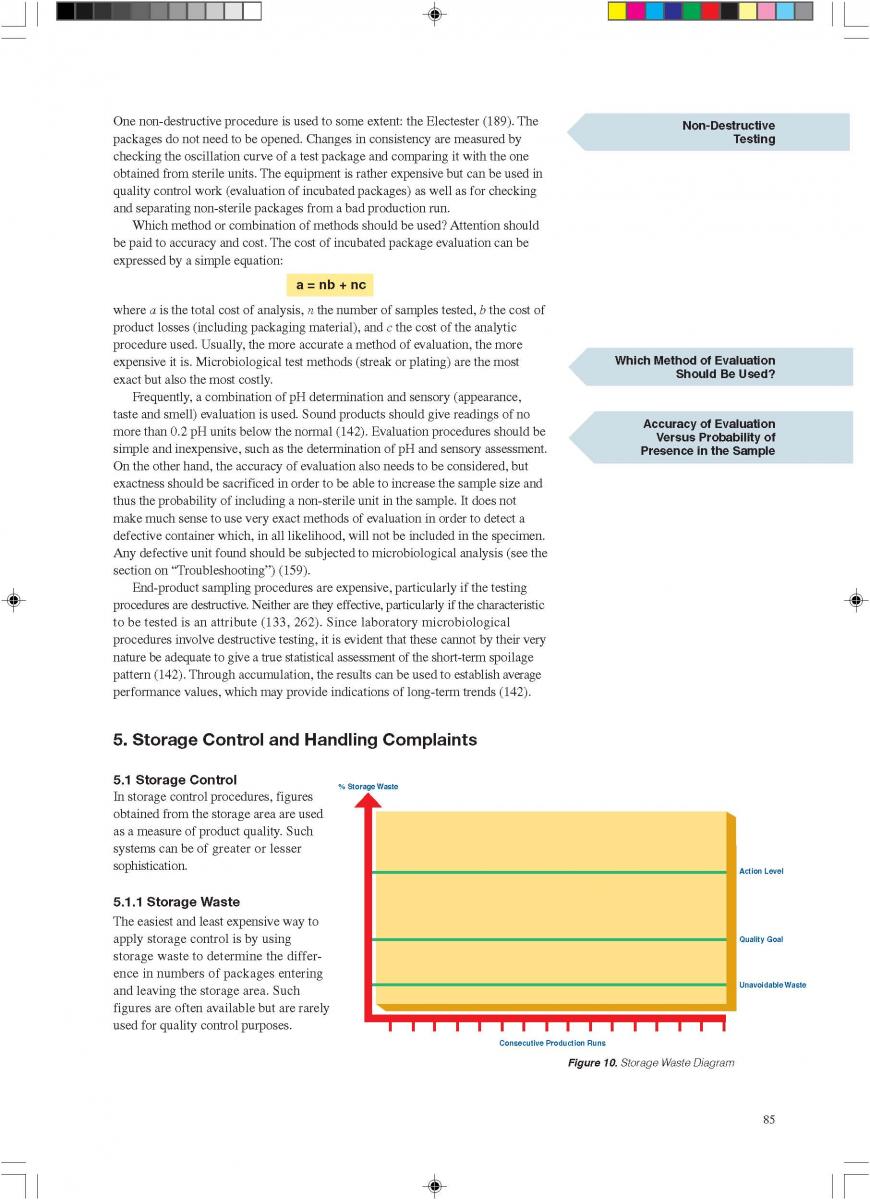
Bacteria, virus an human life
 Do you know what live in a tiny water? How many bateria and viruses are affeting human's lives. Now we granted soap and bathe actually took a long time to be accepted in human lives. Our skin and hair will appear as the valleys and huge caves to the microbes. Bacteria can cause illness and allergy, they can also eat the flesh of human being. Some bacteria can even explore in the brain and break the brain. And the -20 C refrigerator, which we think being safe, actually is some bacteria's living bed and they can kill us if we eat the stored foods without heating. Some bacteria still live in the UHT product quietly without being feeling or seen. Some can do benefit to us such as making cheese and yoghurt. The toxin of clostridium botulilum is 1000 times as the most dangerous snake in the world, but they can remove the skin and face's wrinkles. Some popular microbes such as those who can make people catch cold, kill people in a 90% probability which is Ebola virus, phages which can make fermenting failing and those which can make tulips more beatiful ...
Movie of bacteria and virus with people
Do you know what live in a tiny water? How many bateria and viruses are affeting human's lives. Now we granted soap and bathe actually took a long time to be accepted in human lives. Our skin and hair will appear as the valleys and huge caves to the microbes. Bacteria can cause illness and allergy, they can also eat the flesh of human being. Some bacteria can even explore in the brain and break the brain. And the -20 C refrigerator, which we think being safe, actually is some bacteria's living bed and they can kill us if we eat the stored foods without heating. Some bacteria still live in the UHT product quietly without being feeling or seen. Some can do benefit to us such as making cheese and yoghurt. The toxin of clostridium botulilum is 1000 times as the most dangerous snake in the world, but they can remove the skin and face's wrinkles. Some popular microbes such as those who can make people catch cold, kill people in a 90% probability which is Ebola virus, phages which can make fermenting failing and those which can make tulips more beatiful ...
Virus relevant Movie:I am legend
I Am Legend is a 2007 American post-apocalyptic science fiction horror film directed by Francis Lawrence and starring Will Smith. It is the third feature film adaptation of Richard Matheson's 1954 novel of the same name, following 1964's The Last Man on Earth and 1971's The Omega Man.[2] Smith plays virologist Robert Neville, who is immune to a man-made virus originally created to cure cancer. He works to create a remedy while defending himself against mutants created by the virus.
Food Safety and Microbial Quality
As one important component of quality system in food and beverage industry, HACCP plays a very effective role in assuring food safety with the precondition that people can use it properly in which practice experience and structured food safety knowledge are the cores to arm people of production unit besides the principle. Policy, guideline and supervison from the government are the other side to assure the food safety in which food safety knowledge, supervising system, and effective legal system are the huge challenges.
Bacteria which cannot be killed by UHT-Nightmare of UHT milk
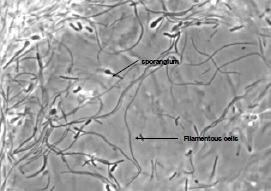 Bacillus sporothermodurans cannot be killed by UHT which contributes the whole batch products' spoilages or unsterilities. Bacillus sporothermodurans producing highly heat-resistant spores (HRS) which may survive ultra-high temperature (UHT) treatment or industrial sterilization. Molecular typing showed a heterogeneous group of farm isolates (non-HRS strains), but a clonal group of UHT isolates from diverse European countries and other continents (HRS-clone) suggesting a common source. During a survey of Belgian dairy farms for the presence of potentially highly heat-resistant spore formers, high numbers of these spores were detected in filter cloth, green crop and fodder samples. The strain collection showed a high taxonomic diversity with 18 potentially new species and with Bacillus licheniformis and Geobacillus pallidus as predominating species overall. Seventeen B. sporothermodurans isolates were identified, mainly originating from feed concentrate. Heat resistance studies showed the UHT resistance of B. sporothermodurans spores present in industrially contaminated UHT milk, but a lower heat resistance of laboratory-grown strains (HRS and non-HRS). Hydrogen peroxide, used as sanitizer in the dairy industry, was found to induce higher heat resistance of laboratory-grown B. sporothermodurans strains to a certain level. This indicates that sublethal stress conditions may affect the heat resistance. By transmission electron microscopy, structural differences at the spore level were found between HRS and non-HRS strains. The data indicate that the attainment of extreme heat resistance is rather multifactorial.
Biofilm changes the characteristic of microbes compromising food safety
 Adhesion of microorganisms to food processing equipment surfaces and the problems it causes are a matter of concern to the food industry. Biofilms have the potential to act as a chronic source of microbial contamination which may compromise food quality and represent a significant health hazard. To control these problems, it has been recognized that a greater understanding of the interaction between microorganisms and food-processing surfaces is required.Several groups have reported the ability of bacteria to attach to surfaces commonly found in the food processing environment, such as rubber and stainless steel . The increased resistance of these sessile organisms towards disinfectants, heat and sanitizing agents often exacerbates the problems caused by microbial fouling and can contribute to the inefficacy of cleaning in place systems. Development of adsorbed layers, often termed “conditioning” of a surface, is considered to be the first stage in biofilm formation and has been widely demonstrated. Because this conditioning film is likely to change the physicochemical properties of the substratum and thus to influence bacterial attachment, an understanding of these initial interactions is crucial in identifying control measures. A variety of proteins, including milk proteins, have been shown to affect bacterial adhesion to surfaces such as polystyrene; hydroxyapatite; glass, rubber, and stainless steel; silica; and medical implants. The nature of the effect appears to vary with the organism, substratum, and protein under investigation.
Clean to remove microbes in the pipelines of dairy plant
How to clean round the bend removing completely any dairy residues in the milk or beverage transfer pipes which may be the growth bed or protection of microbes.
Guidelines for the microbiological quality of some ready-to-eat foods sampled at the point of sale
Requires 30 POINTS in the General category.Infection source of bacteria frequently found in Dairy industry
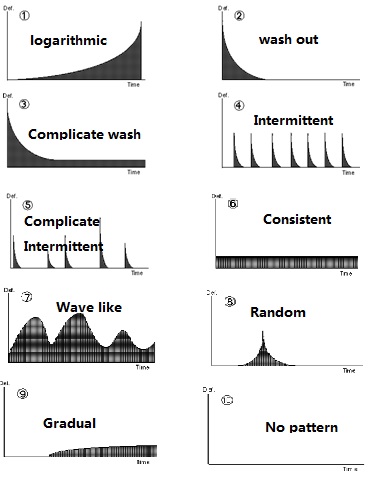 Where do the bacteria come? Using infection pattern, the question can be answered.
Pattern 1: logarithmic
Either the rate of infection at the source increases with time and/or substantial microbial growth takes place somewhere in the system.
One area that can be excluded/eliminated from such a scenario is faulty CIP or pre-sterilisation.
But leakage of paper tube, leakage of Valve 78, leakage of Aseptic tank, holding section of UHT and contaminated floater etc. have high probabilities.
Pattern 2: wash out
CIP/Sterilization failure linked bacteria residues often contribute such scenarios. Filling tube of Tetra Fino often give mixed cocci contamination if the tube is scratched by wrong cleaning brush, the seat of Valve A sometimes give endospores wash out if the manual clean is not carried out in a very long time. Because Escherichia can grow vigorously in organic residue, the poor CIP may result pure Escherichia flora.
Pattern 3:Complicate Wash out
Besides the cause found in wash out pattern, raw milk with poor quality such as more endospores, leakages in the product transfer pipeline, gasket leakages in the product pipeline, leaked aseptic chamber, upper cover of Tetra Fino, low consentration of H2O2, no tween80 added to H2O2, and leakages in cooling pipeling of aseptic air system in Tetra Fino may result such contamination pattern.
Pattern4/5: intermittent
•Probe leakage—seep into milk; •Operational fault—splicing PM; •Homoginizer fault resulted rough particles with spores; •Counter-Valve such as V78; •Gasket leakage or holding section leakages in UHT etc.
Pattern 6: consistency
Wrong operation such as selecting wrong sterilization program in UHT; Failure of equipment such as poor sealing, equipment components or equipment settings out of specification such as low sealing pressure, and poor quality milk with thermo resitant spores etc.
Pattern 7: Wave like
It is the combinition of intermittent pattern and consistent pattern.
Pattern 8: Random
Often it is caused by operational fault.
Pattern 9: Gradual increase
No bacteria multiplication, but reinfection increases. For example, the jaw system loses its pressure grdually. The white roller loses its pressure gradually.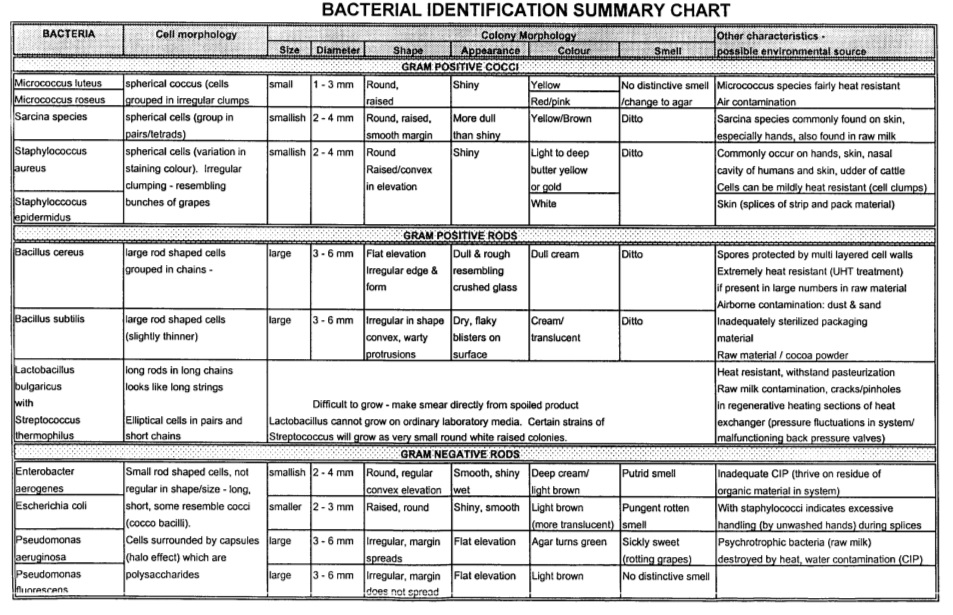
Manufacturers and Processors requirements of ice cream, ice milk, ice cream mix and frozen youghurt
Requires 30 POINTS in the General category.Microbiological Quality of Ice Cream after HACCP Implementation: a Factory Case Study
Requires 30 POINTS in the General category.Movie - Avoid microbial infection or contamination in aseptic production
How ro remove microbial contamination in aseptic production is always a challenge. If the contamination is very little, the survivors will be less when processing. Once contaminated by microbes in the milk, the speed of microbes mulplification will be higher than the light. The visual coagulation or spoilage usually resulted by more than 100 million bacteria. Keeping a good habit in production is always a must such as clean hands routinely, clean floor routinely etc.
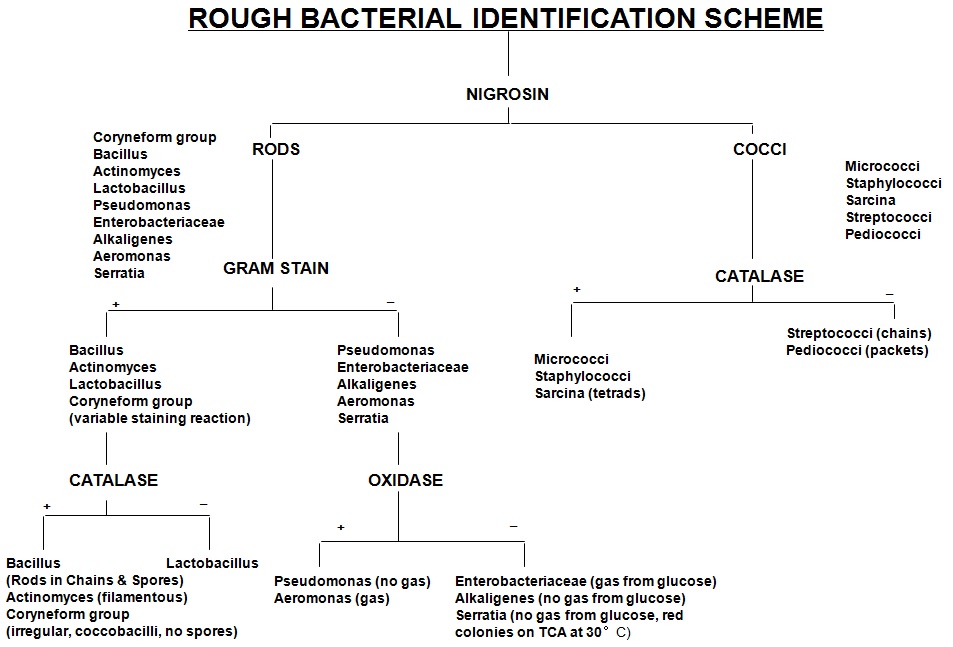
Keeping Cows Cool and Comfortable to Improve milk production of cow
When things get hot, we find ways to cool down. We fire up air conditioners, get wet, or get the air moving with fans. Our animals are no different. They feel the heat, and they want a break from it as well.
It’s a proven fact that when cows overheat, milk production goes down. It’s been proven time and again that severe heat stress in dairy cows can result in milk production loss of up to 25%. That is a quarter drop in overall milk production, so keeping your herd cool is imperative to keeping milk production up. There are a few different things that can be done to improve your herds comfort when the temperature starts to rise.
Have you ever been outside on a hot day and think…what I wouldn’t give for cold shower right now? When we sweat, we are using the moisture to draw the heat away from our skin. This same theory applies to cow cooling or misting systems. There are many out on the market today. At the farm where I worked, the misters were set up along the stalls, so that when the cows went to eat, they were “misted”. Be sure to use a system that uses water efficiently, but also uses enough water to penetrate the hide and reach the skin. It will then draw the heat away from the cow’s body, just like when we jump in a pool or take a cold shower. Our bodies are instantly cooled by the water drawing away the heat and this same theory applies to our animals.
Air movement is also critical. Stagnant air will feel hotter. Like the water drawing away the heat, so too can air movement. Fanning systems are a great way to help keep your herd cool and comfortable. There are also many systems out there, from your basic fans over the freestalls, to setting up a tunnel system where the air will actually be forced through the barn. When the air is moving, even in hot conditions, it can make a big difference in reducing heat stress in your herd.
Many systems combine these too main elements, water and air, using fans and sending a mist with the air to help reduce water waste while achieving the same or better results. It’s important to do your research first and find out what’s going to work best for your farm, and your herd.
Also, always have cool, clean water for your cows to drink. She needs to stay hydrated to help reduce heat stress, keeping her milk production high and at its best in hot weather.
What about calves?? They are no different when the heat kicks in. A few simple steps can be taken to help keep them cool and healthy as well. Besides methods mentioned above, there are a few small things you can do to ensure a calf’s comfort. Make sure they have clean, cool water to drink. Be sure that all pails are clean and sanitized after each use. If you need to handle the calves, consider changing the time of day when you do, opting for cooler parts of the day like early morning, or evening hours, and make sure shade is readily available. When a calf isn’t using all her energy to stay cool, she’ll be able to use that energy to grow and stay healthy.
With a few simple techniques your herd can stay cool and comfortable, and reducing heat stress will help keep milk production high even during the hottest times of year!
By Susan Glenzinski 07.2012
Israeli Dairy School
Operation and quality management
Introduction
To help you to start a toy manufacturing company , we strongly believe that Operation management and quality management is a very important factor, and could not be neglected in your management system. In order to prove this point, we will set out the overall impact as the beginning.
With the rise of the service sector, the concept of the further expansion of production, and gradually to accommodate the non-manufacturing service sector, including not only the manufacture of tangible products, but also include intangible services. The implementation of effective operations management is increasingly. Faced with such pressure, quality management become indispensable.
So firstly we should understand that the goal of the Quality Management program(QMP) is to establish leadership structure throughout the path of quality workflow that enables merry toy manufacturing company to provide high quality services. We are designed to promote quality and child’s entertainment and safety and also operations efficiency through process strategy,quality management, inventory management and supply chain management
Quality management
Business profile:
Merry is a toy manufacturing company. It deals with the production and sales of various toys. As we all know, children related consumption is a good gold digging point, thus it’s certain that many businesses go for it. Toy industry is one of the competitive battlefields.
There are mainly three components of quality management: quality control, quality assurance and quality improvement. Most of us would take the simple view that quality management is just concerned with product quality. In fact, that’s not complete. Quality management also deals with the control of manufacturing process. For the company whose dominant business is the manufacturing and selling of products, like Merry, quality management is especially important. High-quality product is the most basic thing your company should focus on to achieve an outstanding performance.
When it comes to quality management, the most classic case could be Six Sigma Methodology. Sigma is the standard deviation used in statistics. Six Sigma is a management approach near perfection, demanding that there must be less than 3.4 defective products or processes per million units. A number of world-class international corporations, like Motorola, Citigroup, Ford, Kodak and General Electric, once employed Six Sigma to keep their leading position in industry. The widely used management methodology characterizes in the following aspects:
- It highlights the customer demand and always treats it as the main breakthrough point.
- It emphasizes the measurement of performance and processes. Based on these, the company comes up with more challenging goals.
- It provides specific performance improving methods for specific purposes and fields.
- It owns a group of trained professionals in its implementation to guarantee the effect.
- It defines the standard and measurement of success as well as the rewarding methods to employees participating in the accomplishment.
- It breaks the barriers between different departments.
All of us know Jack Welch and General Electronic. In the mid and later years of 1990’s, Jack Welch became a loyal seeker of Six Sigma Management. This led to GE’s great success and the whole world’s eyes.
Actually, quality management has many classic theories besides Six Sigma, like PDCA Cycle (Plan-Do-Check-Action) and Total Quality Management. They have been raised and being used universally in today’s society. Those successful stories can give you some experience on the quality management. In the daily operation of your toy company, you can borrow and use it.
Process strategy
Business profile:
Merry is a toy manufacturing company. It deals with the production and sales of various toys. As we all know, children related consumption is a good gold digging point, thus it’s certain that many businesses go for it. Toy industry is one of the competitive battlefields.
To obtain an advantage over the rivals, process strategy and supply chain management are vital.
Process strategy is to figure out the way of doing right things to improve the productivity or efficiency. After recognition of a better process, the existing process can be optimized to achieve a much more satisfying performance. Let’s take an automobile manufacturing factory as an example. With rapid development, its scale and labour had increased a lot yet no change in management system. So a bottleneck occurred. Under the guidance of experts, the company began to realize the problems and optimize its process, including standardization of process instead of process mess among different departments, process function reinforcement instead of useless form, process supervision instead of ignorance of the implementation. The adoption of these process strategies did give much vigour to the company: the production had been soaring; what’s more, the employees had been more disciplined and organized. This example tells how the process strategy can help us make a breakthrough and yield twice the result with half the effort. Besides those measures, process strategy also includes process restructuring, process cutting and process control etc. In reality, most manufacturers neglect the importance of process optimization. They put all their emphasis on the equipment or technology. I hope your toy factory will draw a lesson from it. After all for a manufacturing factory, production is the top priority needed to be dealt with and is a critical competitive point. You will benefit a lot to take process strategy into consideration in the production of toys.
Supply chain management
According to Tom McGuffog, Supply Chain Management (SCM) is "Maximizing added value and reducing total cost across the entire trading process through focusing on speed and certainty of response to the market." Supply chain is so complicated a system that it needs efficient coordination and management. Huge invisible profits are hidden between every two chains. The purpose of SCM is to squeeze out those profits continuously. To understand this more vividly, I’d like to employ the most classic case Wal-Mart. As the global number one retail business, Wal-Mart’s SCM consists of four parts:
Customer demand management: All businesses know the motto “customer is God”. Only stick to our commitments to customers can we make the most profits. High quality products and high standard services are the basic things we should do.
Supplier and partner management: Wal-Mart has established strategic relationship with P&G. It provides P&G with plenty of room to demonstrate itself freely; it uses P&G’s fame to popularize itself. They are digging potential mutual benefits instead of grabbing the existing cake.
Inner-company and between-company logistics management: Wal-Mart established its own logistic system to guarantee most efficient and instant delivery. Marching with technology, the system has realized automation.
Information communication based on internet or intranet: Wal-Mart is the first retail business to launch a communication satellite. With the help of the satellite, Wal-Mart makes delivery keep the same pace with sales.
Maybe you can learn from the success of Wal-Mart and stress the importance of SCM. The key point of SCM lies in close relationships and cooperation between upstream and downstream companies. For your toy factory, for example, you can consider carefully the best location of factory for the convenience of delivery to your downstream customers. Also, you can design a customer feedback system to understand the customer’s real demand and comment at the first time.
We can see both process strategy and supply chain management are scientific approaches to achieve the effect of Pareto Optimality.
Inventory Management
Inventory management, the planning and controlling of inventories in order to meet the organization, is an important concern for managers in all types of businesses. Inventories are important to all types of organizations, their employees, and their supply chains. Inventories profoundly affect everyday operations because they must be counted, paid for, used in operations, used to satisfy customers, and managed. Nonetheless, companies realize that the availability of products is a key selling point in many markets and downright critical in many more.
Certainly, too much inventory on hand reduces profitability, and too little inventory on hand creates shortages in the supply chain and ultimately damages customer confidence. In this respect, Merry does very well. Despite the many changes that company goes through, the basic principles of inventory management remain the same. Some of the new approaches and techniques are wrapped in new terminology, but the underlying principles for accomplishing good inventory management has not changed. Its inventory management designed to meet the dictates of the marketplace and support the company's strategic plan.
The company of Merry uses J-I-T (just in time) and J-I-C (just in case) systems. The company provides the products what does customer want and when does customer want. Merry provides the products in time and in case. So, it decides that Merry should have a good inventory management. The inventory management system provides information to efficiently manage the flow of materials, effectively utilize people and equipment, coordinate internal activities, and communicate with customers. Inventory management does not make decisions or manage operations; they provide the information to managers who make more accurate and timely decisions to manage their operations.
So, many customers always like Merry! This good inventory management makes the company get more benefits and more money. Because of this Merry can be so development! It shows that how important the inventory management is!
Conclusion
Overall, good inventory management to meet the market domination and support the company's strategic plan. Good supply chain management to required the right product (Right Product) can be at the right time (Right time), in accordance with the correct amount of (Right Quantity), the right quality (Right Quality) and the correct state (Right Status) to the right place (Right Place), therefore, to increase the enterprise competitiveness. Good process strategy can be optimized to achieve a much more satisfying performance and improve the productivity or efficiency. Good quality management ensure product quality and increase core capability of enterprise. To bulit a good operation and quality management is a good foundation for business success.
References
- T McGuffog, N Wadsley, (1999) “The general principles of value chain management”.
- R Wilding, (1998), “The supply chain complexity triangle: uncertainty generation in the supply chain”.
P Trkman, MI Stemberger, (2005), “Information transfer in supply chain management”.
How to run an excellent service team
Service quality is promising to customer and expectation from customer affected by safety, reliability (No breakdown) and dependibility (Can solve problem) etc. which affects customer's reputation and product's consistency. So everything one service team does needs to be customer oriented. And customer oriented behaviors include competitive service benchmark or KPI, do right first time, keep continuous improvement. Especially when customer meets issues, the feedback must be quick and the result must be sustainable. To fulfil it, the root cause must be found and engage the customer in loop on a certain extent. The ultimate strategy is to satisfy customer by world class service performance. And the route is to have the qualified on-time service and solve problem quickly once it happens
If defects are detected from line, is it caused by machine itself or by the whole line?
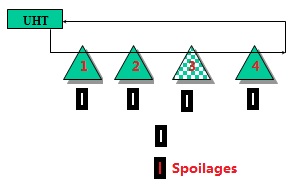
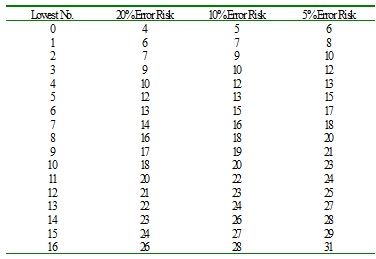
The production manager often meets the scenaria that series of machines are linked together forming one line to produce. And then we find the spoilages after being incubated. Do the soilages or unsterilities come from the indiviual machines or fillers such as 1, 2, 3, and 4. Or they come from UHT?
The significance table can give you the answer.
we need to take samples from the doubted filler and the reference. For example, we doubt the defects come from machine 3 and the other machines are normal. When taking samples from Filler 3, we also need to take samples from one reference machine such as 1, 2, or 4.
If the spoilages are found from machine 3 being 9, and 3 defects are found from filler 1, 2 and 4 at the same time. We can have the conclusion that machine 3 has its own problem besides the common problems from all of the mchines at the risk of 20%. If spoilages from filler 3 are 10 or 12, the rish will be 10% or 5% respectively.
We can query the counted unsterilities from different machines to compare. And often we use the risk being 10% to judge.
Innovation thinking
Q-questioning
O-observing
E-experimenting
N-networking
A-associating
Samples change
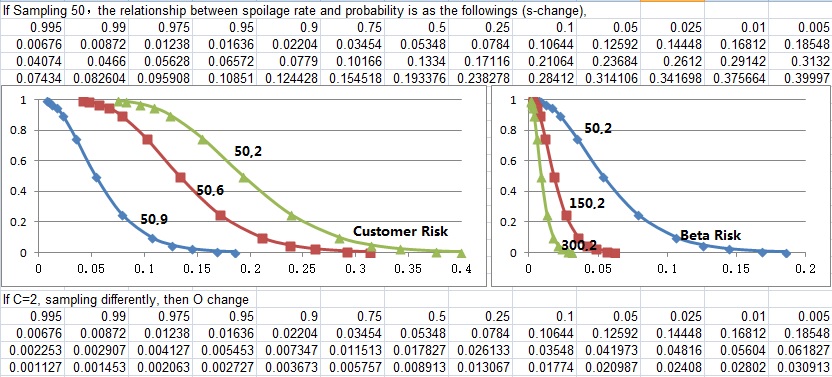
Samples change will affect alpha (manufacturer) risk, and beta (Customer) risk. O curve sampling change affects customer risk more dramatically than S curve sampling change. When detecting same spoilage rate, sampling more means less customer risk, but more manufacturer risk. S curve change is samples remains unchanged with more spoilages found. And O curve change is that samples increase with spoilages reamain unchanged.
TPM world class management
 The final competition of any industry is management. The key of morden enterprise' high competitiveness is to make lean production, improve efficiency, assure quality and optimize or reduce cost. The target of TPM is 0 accident, 0 defect, 0 breakdown. TPM (Total productive maintenance), the best certificate of which is WCM (world class management), is the eternal chasing of morden manufacturing industry. Many enterprises, who want to be excellent, take it as the secret weapon to satisfy the customer by optimizing capacity, delivery, quality, cost, morale and environment.
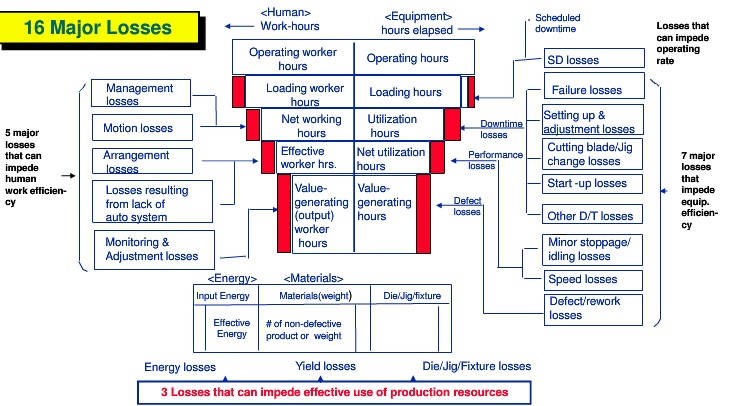
6 Major manufacturing Losses (Waste)
1, Downtime Losses
(1) Equipment failures
(2) Set-up and adjustments
2, Speed Losses
(3) Idling and minor stoppages
(4) Reduced speed (actual operating vs. designed)
3, Defect Losses
(5) Defects in process
(6) Reduced yield between start of production and stable production.
Elimination of other Wastes (Mura, Muri, Muda)
1, Operator Time Losses
Manpower losses due to operation time being done more slowly than standard time (Cycle time > Standard Time)
2, Material Losses
Losses in yield due to "inherent waste" (Cut-off stock, Set-up pieces, prototype, etc.)
Energy losses such as electricity, gas, and water when machinery is not doing value-added work.
Idling losses due to inadequate sensors and product buildup on conveyors and chutes.
6 Sigma DMAIC
DMAIC is a structured problem-solving methodology widely used in business. The letters are an acronym for the five phases of Six Sigma improvement: Define-Measure-Analyze-Improve-Control. These phases lead a team logically from defining a problem through implementing solutions linked to underlying causing, and establish best practices to make sure the solutions stay in place. The structure of DMAIC encourages creative thinking within boundaries such as keeping the basic process, product, or service. If your process is so badly broken that you need to start over from scratch or if you’re designing a new product, service, or process, use Design for Lean Six Sigma (DMEDI).
|
Define |
|
Measure |
|
Analyze |
|
Improve |
|
Control |
|
Project charter |
|
Detailed value stream |
|
Decide key process, input and output |
|
Potential solutions |
|
Mistake proofing |
|
Target review |
|
Identify key input ,process, output |
|
List potential root cause |
|
Best practices |
|
SOP |
|
Customer feedback |
|
Operational definitions |
|
Reduce list of potential root causes |
|
Develop to be value stream map. |
|
Process control and condition management |
|
Financial benefit |
|
Data collection plan |
|
Confirm root cause effect on output |
|
Pilot implementation |
|
Implementation solutions and measuring |
|
High level value stream map and scope |
|
Validate measurement system |
|
Estimate impact of root causes on key outputs |
|
Confirm attainment of project goal |
|
New opportunities |
|
Communication plan |
|
Collect baseline data |
|
Prioritize root causes |
|
Rollout plan |
|
Lessons learnt |
|
Team building |
|
Process capability |
|
|
|
|
|
Skill matrix |
|
General plan |
|
|
|
|
|
|
|
|
|
Gate summary |
|
Gate summary |
|
Gate Summary |
|
Gate summary |
|
Gate summary |
Two primary options for implementing DMAIC:
- Project-team approach
Black Belts deployed full-time to projects
Team members work on the project part-time-work on the project is interspersed with regular work.
Full involvement by all team members in all phases of DAMIC
Duration can be 1 to 4 months depending on scope
- Kaizen approach
Rapid (1 week or less), intense progress through all of DMAIC except full-scale implementation
Preparatory work on Define, and sometimes on Measure, done by a subgroup (team leader and a Black belt, for instance)
Rest of work done by the full group during several days or a week when they work ONLY on the project (Participants are pulled off their regular jobs)
Two indicators that you should follow all of DMAIC:
- Problem is complex: Need to involve different people in different level or departments.
- Solution risks are high:May affect current process, customer, product or service.
It is human nature to want to jump to solutions and quickly make the improvement. If you think you have an obvious solution with minimal risks, you can try skipping some of the DMAIC steps. But before you do so, ask:
- What data do I have to show that this idea is the best possible solution?
- How do I know that the solution will really solve the targeted problem?
- What possible downsides are there to the solution idea?
If you get the negative answers to the above mentioned questions, you need to work through all the DMAIC phases.
9 steps continuous improvement (CI) activities
 The Primary aim of CI pillar is to determine the root cause of the problem in eliminating the 16 major losses.
CI activities encompass all of the 8 TPM pillars.
PM pillar topic is Maintenance or organization of planned Maintenance Activities with the detailed activities being as the followings,
- Periodic Maintenance
- Predictive Maintenance
- Corrective Maintenance
- Breakdown or deployment Maintenance activities.
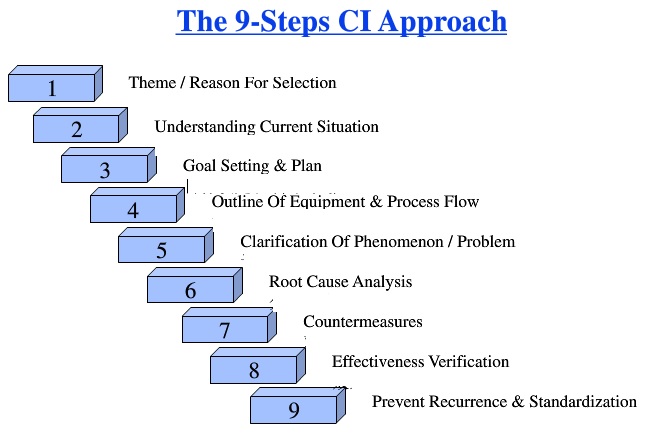 AM pillar topic is Manufacturing with the detailed activities being as the followings,
- Correct operation
- Oiling inspection
- Cleaning
- Tightening
- AM data analysis
- Restoring
- Dealing with...
- Minor stoppages
- Speed loss
- Specification review/Report
- Zero defects
CI/QM Pillar topic
- 8 equipment & 5 manpower losses & Zero defects
- Dust free root cause analysis
- One stop defect free changeover
- Fan In/Fan out
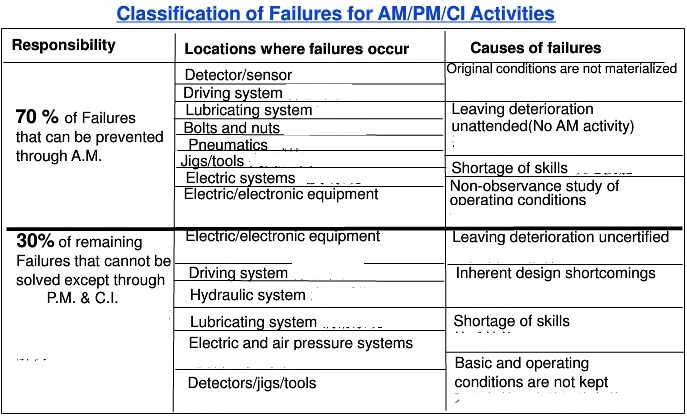
Step1: Theme or topic selection
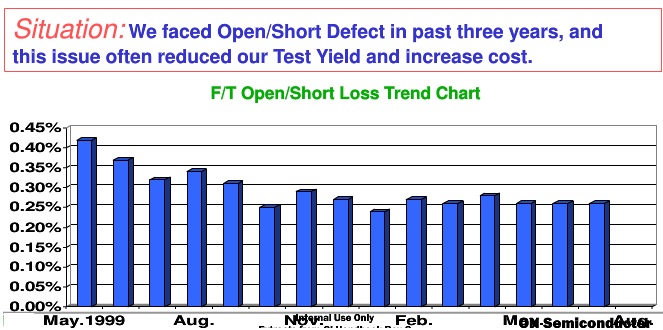 Step1: Theme or topic selection
1.1Linkage to factory metric/strategy
Hints: How does it affect factory performance? % impact to bottom line?
1.2How do you select the FI project?
Hints: Line Balance chart, ABC model, Bottleneck Area, Value stream mapping, work needed in the Bottle neck operation.
1.3Evidence as proof, Correlation, Mutual & Future understanding
Hints: Visual sample of good product with relevant dimention (Valid for VM defects)
Step2 Understand current situation
1 Start with a big picture-Overall trend
Performance or Defect Trend charts by Months or Weeks
2 Paretorise the key factors data
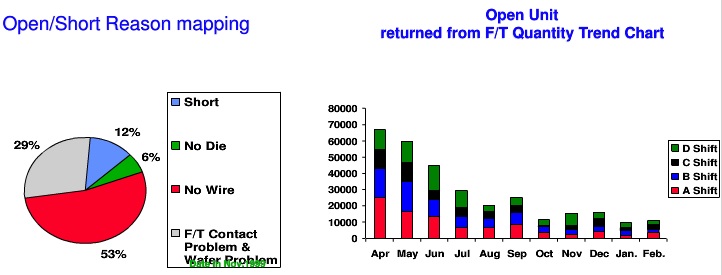
Step3 Goal setting and planning
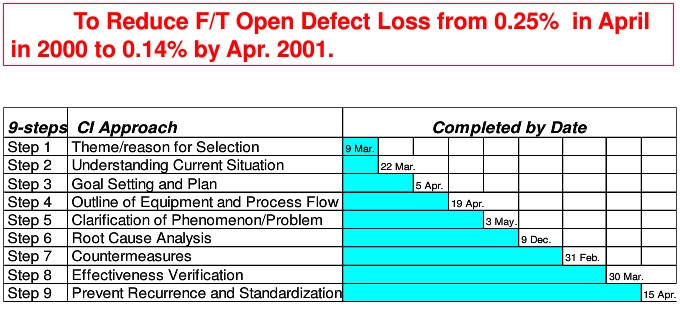
Step4 Outline of Equipment and process flow
Equipment and process flow (Genba or go see here till Step 8)
Hints: Outline major Equipments and process steps related to the problem.
Use Five Genes for data collection
Go to shop floor, observe actual conditions, collect/verify data and confirm losses.
Do not depend on second-source data.
Japanese Definition
Genba On-site
Genbutsu Actual Object
Gensho Phenomenon
Genri Theory/Principle
Gensoku Rules & Standards
Step5 Clarification of Phenomenon and problem
Phenomenon is an occurrence of fact that can be observed.
To avoid on assumptions, observe phenomenon live on the shop floor.
To help clarify the Phenomenon statement, ask
1, During what specific machine operation does the phenomenon occur?
2, Does it always occur under the same circumstances?
3, Does it occur at regular or irregular intervals?
4, Does it get better or worse over time?
5, Does it occur on more than one machine?
6, Does it occur only for certain operators?
Clear understanding of problem=half the problem solved.
Link phenomenon to specific process or machine, such as,
- Post Mortem on defective units: a) Examine units for clue leading to root cause of problem. b) Items checked are: Scratch or Chip on Surface of packages /leads/...
- Defect mapping or Multi-Vari study: a) Check Pattern/trend/Location for which defects occur b) Draw conclusion
- Prepare Table for validation a) List equipment / process flow in column 1; b) List content for Validation in column 2; c)List Validation Result in Column 3.
- Equipment process validation a) Validate evidence from 5.1 to 5.2 against each equipment /process in this step. b) Enter results in Column 3 of which OK=No problem form this machine or step NG= not good, problematic area, to identify difference. P= potential, to include as item for further validation in step6.
- Zoom in on problematic step/flow
Step6 Root cause analysis
1, Sub process analysis
a) Zoom in on the problematic sub processes
b) Identify all failure modes
c) Perform restoration for obvious failure modes detected during Genba.
2. Perform Why-Why Analysis or other analysis tools for each failure mode.
3. Restoration needed only when
a) This is the Spec. need
b) This is what we found (Not per spec)
c) Corrective action: Restoration per spec (All dimension shall be quantified.)
d) Identify permanent corrective action to prevent recurrence.
4. Result for restoration: Validate result of restoration
a) Result 1 is the physical outcome of the restoration
a1) The restoration will bring back accurancy to within +-o.5mil or force with +- 10kg/cm square
a2) Validate that the above is obtained
a3) If not obtainable, then identify what has changed before proceeding.
b) Result 2 is the final outcome on defect elimination
b1) If (a) is fully characterized, the result is Given and we will definitely see the improvement.
b2) If not, then identify what has changed before repeating restoration.
Understand operating functions and principles of the equipment or process.
-Perform step by step functional sequencing mapping of the equipment or process.
-Perform detailed process mapping of the equipment or process.
Step7 Counter measures
1 Improvement proposals and implementation
a) Define problem statement form what has changed.
b) Put up proposal to overcome the above problem
c) Implement Proposal
2 Result of improvement
a) Validate result of implemented action with respect to quantified data that is accuracy within +_ 0.5 mil or force within +_ 10 kg/cm square.
b) Standardize setup method etc.
c) Train respectively.
Step8 Effectiveness verification
1 Validate improvement in defect/problem elimination
2 validate impact of improvement to factory indices
3 Calculate cost saving or avoidance
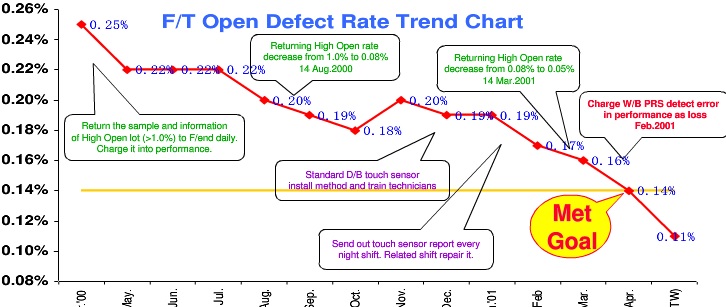
Step9 Prevent Recurrence and standardization
1, Fan in /Fan out through QM pillar
a) All machines within the department/sites
b) Similar machines within departments/sites
2, Maintenance prevention data
3, Sharing in Engineering showcase/Symposium etc.
4, Recognition through SGM.
Focused improvement
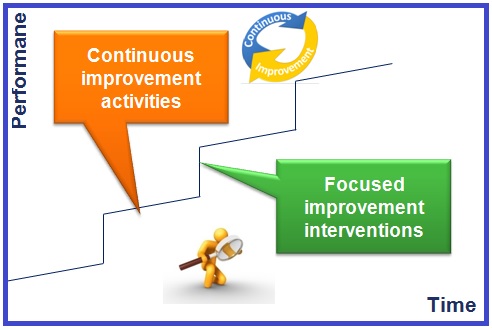 Let us first clarify the terminology we will be using: This diagram illustrates the difference between CI (Continuous improvement) and FI (Focused improvement).
CI describes the day-to-day “continuous” activities by employees to improve all aspects of asset management. These are normally small incremental improvements across a wide front and based on recommendations, intuition, intelligence and the experience of a motivated group of employees.
FI describes the dedicated “focused” interventions to make a substantial improvement in a very specific aspect of asset management (eg excessive breakdowns or high number of accidents) through a structured process of problem solving.
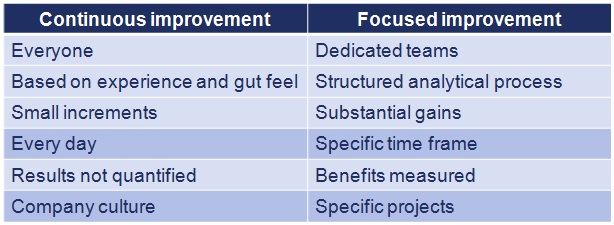 We will address Focused Improvement in this module.
So what do we focus on?
Firstly, senior management needs to give direction in terms of the organisation’s strategic goals. We all need to focus on what is important for the organisation as a whole.
Another focus area is often where the most money is lost, based on a thorough loss and waste analysis. This could typically be lost income because the income generating equipment is not available, or it could be excessive costs due to material waste, high overtime or some other inefficiency.
The strategic goals are normally deployed to team level in order to give them direction and focus.
The important thing is that we need to mobilise and focus our limited available resources (time, funds and people) on areas where the organisation can gain the most benefit (like a laser beam). Everyone in the organisation should be clear about these focus areas and their improvement activities should be guided to be in line them.
 If a piece of equipment is suddenly underperforming, far below the lower control limit of the specifications. A typical example is the MME of a production line which suddenly drops from 98% to 85%.If the costs or implications are significant, this situation will require further investigation. That is where our problem solving tools need to kick in.
Once we have identified the opportunities for improvement, we need to follow a structured problem solving process to achieve sustainable and effective improvements. We will be using the same steps as the Six Sigma methodology which is DMAIC. It gives a solid framework for problem solving, irrespective of the sophistication of the tools used. Beware of your instinctive nature to take short cuts and jump to conclusions without proper analysis! You will regret it afterwards!
Let’s now look at the first step – Define. Before we can find the root cause or solution, we need to understand the problems and associated facts better. We will do this by gathering the available information to define the problem effectively using what (happened), where (happened), who (involved), when, why and how (big/much/many) tools abbreviated as 5W1H.Here it is important to focus all efforts on the specific problem to be addressed by defining exactly what the problem is. Don’t be too vague. The objective is to focus the efforts of the problem solving team on the real problem and avoid any side issues. The usually asked questions are what should be investigated? How does it impact such as cost? What is the improvement target? When should it be improved? Who must investigate it? It is also necessary to define the team members, the target improvement and the time scales.
Now we move on to the second step - Measure: Remember to gather the information from specifications, the people involved, when it happened, and historical data from the EAMS. An important principle here is to look for the story behind the numbers. Use the Pareto principle and its importance in data analysis:
The quote is a saying which is often used by Six Sigma Black Belts when they analyse a problem.
Once we have studied the data, we need to find the root cause(s) which is the 3rd step of DMAIC.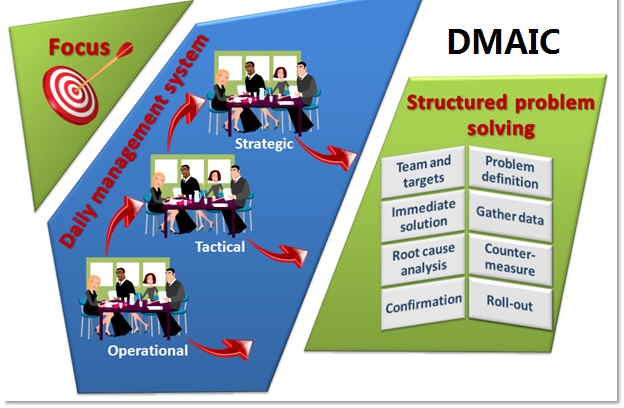 Here it is important to follow the golden thread of cause-effect analysis or 5 why or A3 analysis in which fish bone is a guiding analysis tool. When you have exhausted the process, you have found the “root cause”. One very popular technique for root cause analysis is the 5 Why. Here you keep on asking why (not necessarily 5 times) until you have found the root cause. Its strength is its simplicity, which makes it ideal for use on the shopfloor.
Quite often, we do not have a linear cause-effect thread, but multiple causes to an effect. In such a case it is acceptable to branch out into different cause-effect branches until there are multiple potential causes. In such a case, we will have to verify and eliminate some of these causes in order not to spend effort on fixing a non-applicable cause. Fishbone or Ishikawa diagram is used to brainstorm different potential causes to a problem, based on the six legged 6M framework:
• Man (or person)
• Machine (equipment)
We will also need to verify these potential causes and narrow them down to the real root causes before we implement step 4: Improve
These are the activities in the Improve step. The aim is to get an effective countermeasure to the problem.
- Identify possible countermeasures
- Select the most cost-effective solution(s)
- Develop an implementation plan
- Confirm logic of results
Another way of looking at the solution is to simplify it. Eliminate anything which could complicate matters:
- Eliminate, combine, simplify.
- Focus on the main issues.
- Find a simple solution, that is effective.
This is the last step in the process to make a successful solution “stick”.
It is also important to roll out successful solutions to other areas. The Japanese call this “horizontal replication”.
- Training
- asset care plans
- standard operating procedures
- Modifications
- Standardisation
... and roll it out to other similar areas
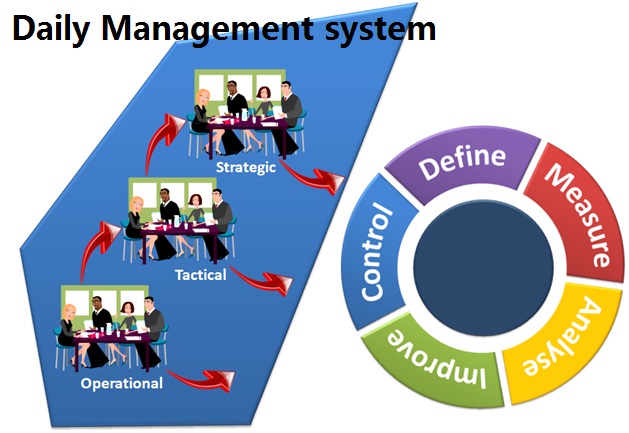 How do we ensure that problem solving is taking place at the right level with quick support by management if required? The solution is a “daily management system” which is a hierarchy of consecutive meeting on different levels in the organisation.
The process starts off with a daily morning meeting that is in line with our STO model. This could be a workshop meeting where the foreman discusses the breakdowns and major problems from the previous day or the night shift. Alternatively, it could be a shift handover meeting between the incoming and outgoing operational supervisors, and area technician. They would allocate major problems (eg downtime longer than 1 hour) to a small team for further investigation and solution.
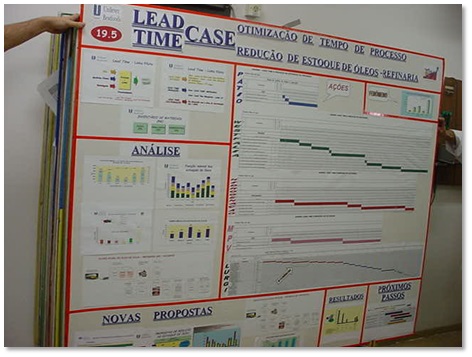 If the problems are beyond their capability, there would typically be a meeting later in the morning, attended by middle management and support departments (eg Material Management, Central Workshop, Services, Engineering, etc) to provide support to the front line staff. They would typically look at more complex problems and systemic problems such as procedures or information systems.
If it becomes clear that the problem is not situational or systemic, but strategic, it needs to be referred to senior management level. This could typically be a weekly or monthly meeting where senior managers discuss supply chain issues, outsourcing, demand management, etc.
It is also important to give the teams feedback on progress and solutions.
Remember to measure and quantify the benefits from the FI projects. It will:
Remember to celebrate and recognise successful improvement projects. It will motivate the team members to improve even more.
So to summarise, this is what focused improvement is all about.
If this is a focus area for your organisation, ensure that everyone is trained in the more detailed techniques of structured problem solving and root cause analysis.
JiPM award and WCM assessment
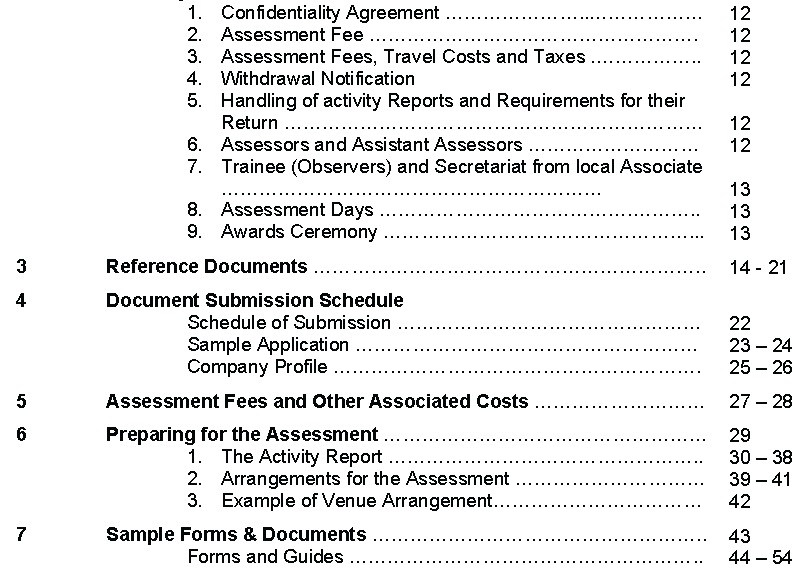 WCM award assessment forms (Only part of it is showed here, you can pay userpoints to download complete version.)

If you have no enough points, you can buy points by clicking http://www.macrolake.com/en/node/907or sharing information including articles, Music etc.
 C
CJiPM award guideline Y2013 English version
JiPM award levels
JIPM award TPM Excellence certificates for 5 progressive levels
Office pillar audit
Requires 60000 POINTS in the General category.Safety audit
Requires 600 POINTS in the General category.Macrolake infinite improvement
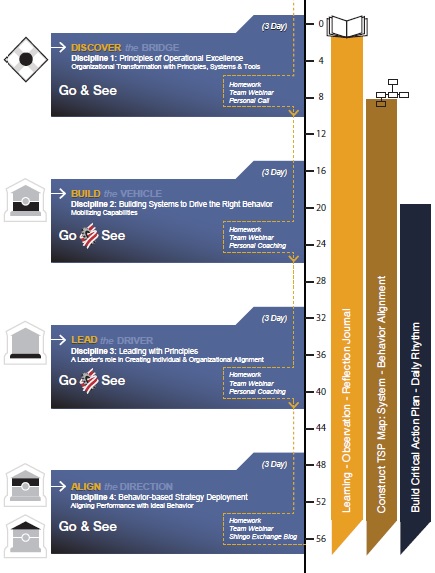
- Describe the benefits of focusing on principles
- Articulate principle-driven behavior
- Identify how tools link to systems
- See and assess behavior to provide constructive feedback
- Explore what adjustments could be made to improve systems in driving ideal behavior
- Select high impact systems to drive ideal behavior
- Scientifically Experiment with adjusting systems
- Re-align systems to eliminate work-a-rounds/fire-fighting
- Build system reliability - monit or behavior
- Clarify teaching role: when to mentor, coach, lecture
- Unify the learning and teaching cycles
- Ask questions that inspire an d motivate
- Unleash talent and passion
- Create a workforce that engages in continuous improvement
- Translate your desired culture into specific behaviors
- Monitor behavior (KBI) an d performanc e (KPI)
- Align and measure the execution of YOUR strategy
- Create a visual map to align and adjust your culture
- Identify key roles and responsibility to manage your culture
Macrolake infinite improvement circle
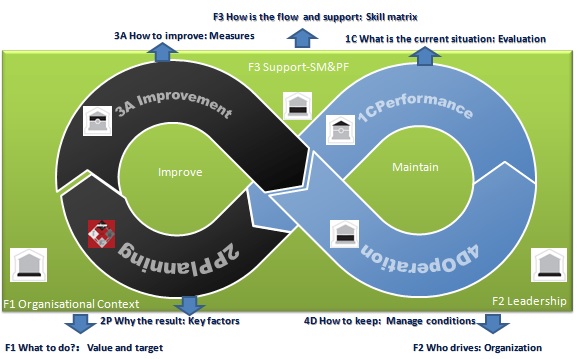
Principle House of Macrolake Lean
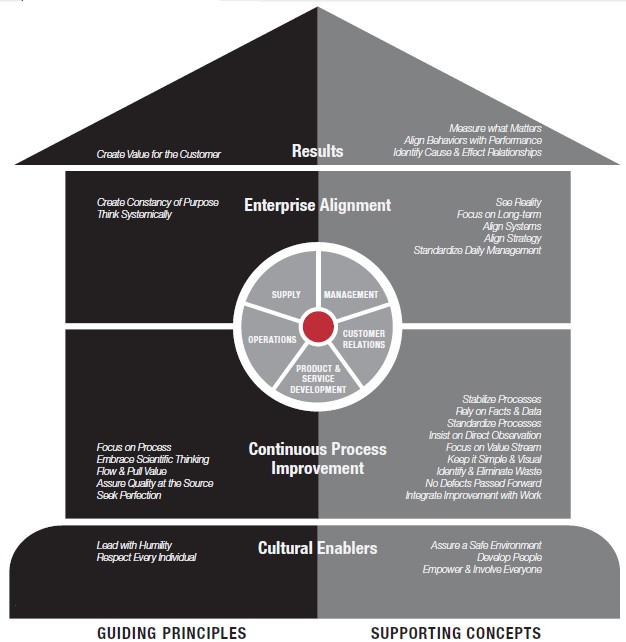 Guiding Principles
Transforming a Culture by Macrolake transformation square
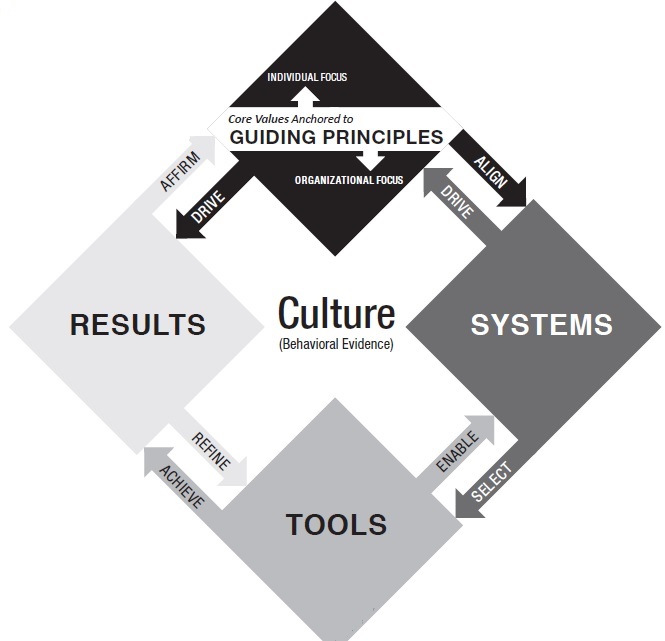 In the 1940s, the work of French social scientist, Jean Piaget, led us to understand that learning occurs when people come to deeply understand the meaning behind the methodology. People naturally search first for meaning, the principle, and then attempt to organize them somehow into a system, or some kind of order. Finally, they create tools to better enable the systems to accomplish the purpose for which they were created.
Start a team oriented TPM
1, Deploy company Strategy to TPM pillars using six Goals (Productivity, Quality, Cost, Safety & Environment, Morale and Delivery). Link instrumental KPIs of every single pillar between six goals according to the strategy of one enterprise. Monitor the instrumental KPIs monthly and review their correlation with strategy periodically.

2, Every 3 months generally review and optimize the correlation between instrumental KPIs and action ones in hierachies. And select several weak areas in specific pillars to be improved using relevant KPIs to direct.

3, Use Pareto chart to analyze the critical losses contrbutors relevant to specific instrumental KPIs. Setup the action KPIs for critical contribution factors and monitor the KPIs change.
4, For every critical factor or instrumental KPI according to differet levels, select the relevant team to be consolidated with skill matrix. Remember to maintain the original ones and added the new skills.

Pillar choose the correct methodology and help team complete the team master plan and target.
Pillar do the deployment and make the team plan(There are 3 waves in one year)
Pillar and high level or WCM leader choose the property team leader and members.
Pillar and team organize the formal team launch meeting. This meeting should invite factory director, WCM office member and all team member. Team’s launch time depending on which day this meeting will be taken. During this meeting, team leader should show which loss the team will focused on, team target, team member, team master plan, team methodology and so on.
5, Map the competences of team members and build skill matrix for each one using 3 level competences which are professional skill, analytical skills and soft skills if appropriate.
Team make the training plan and pillar help team to arrange the trainer. Training record will transfer to ET pillar.
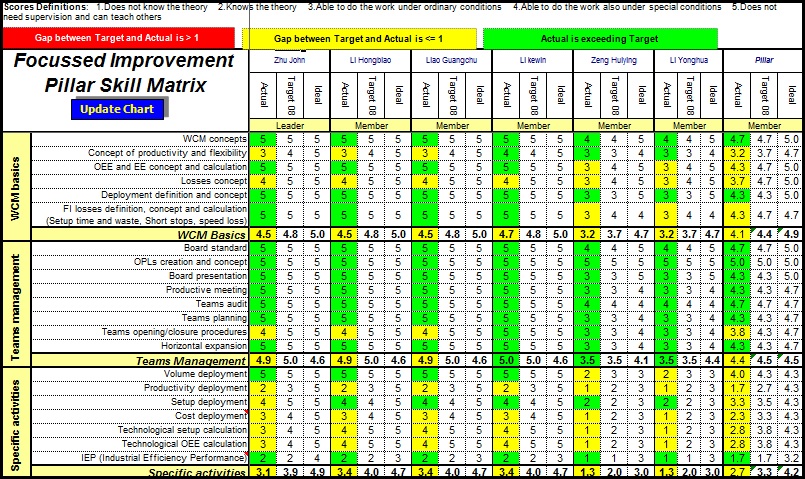
6, Monitor the direct KPIs of team to be maintained or improved.Pillar do the audit based on audit plan to guarantee team running well
Pillar need to follow the following audit schedule:
Kaizen team need to be audited every week;
Normal team need to be audited every two weeks.
If the team delay, we recommend pillar shorter the audit frequency.
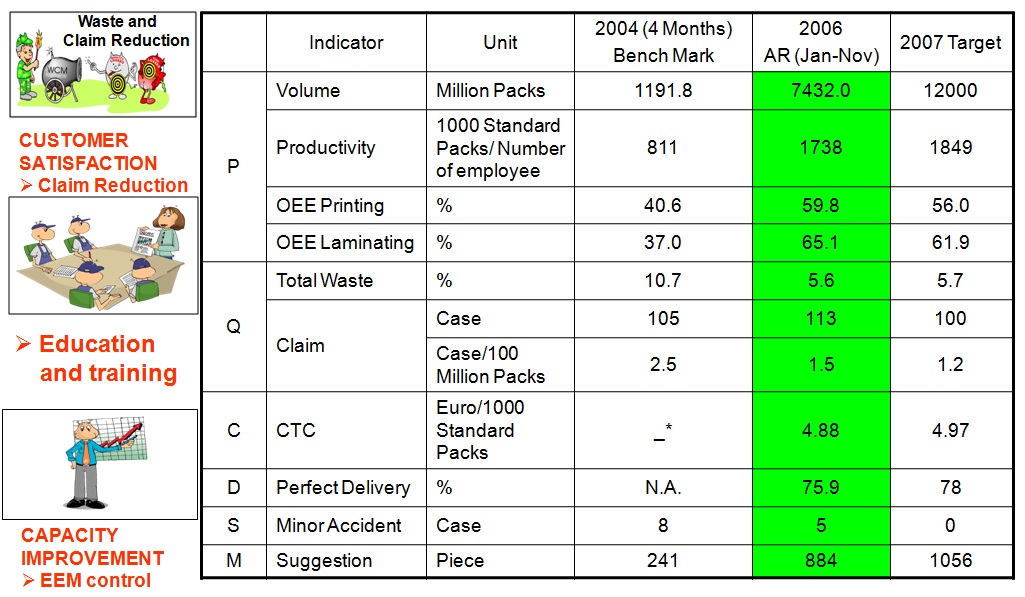
Link global strategy to specific plant
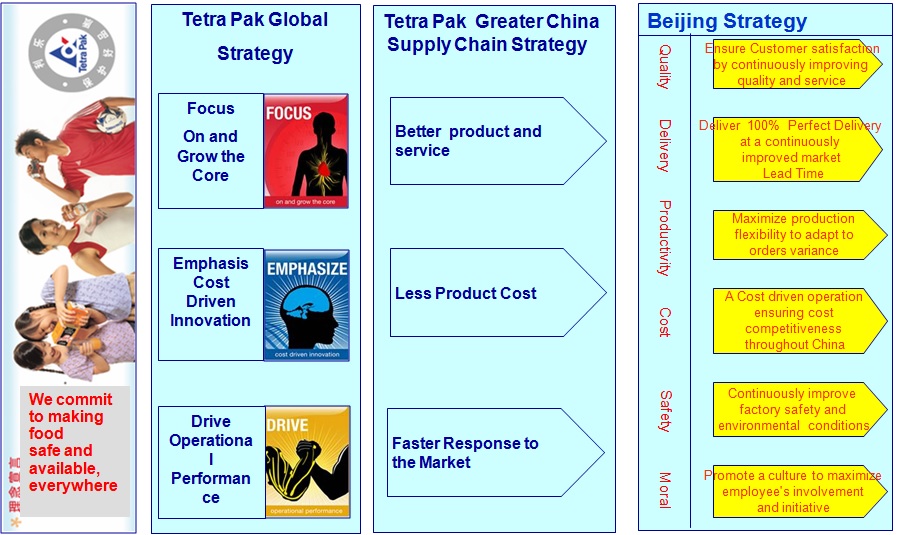
WCM pillar organization
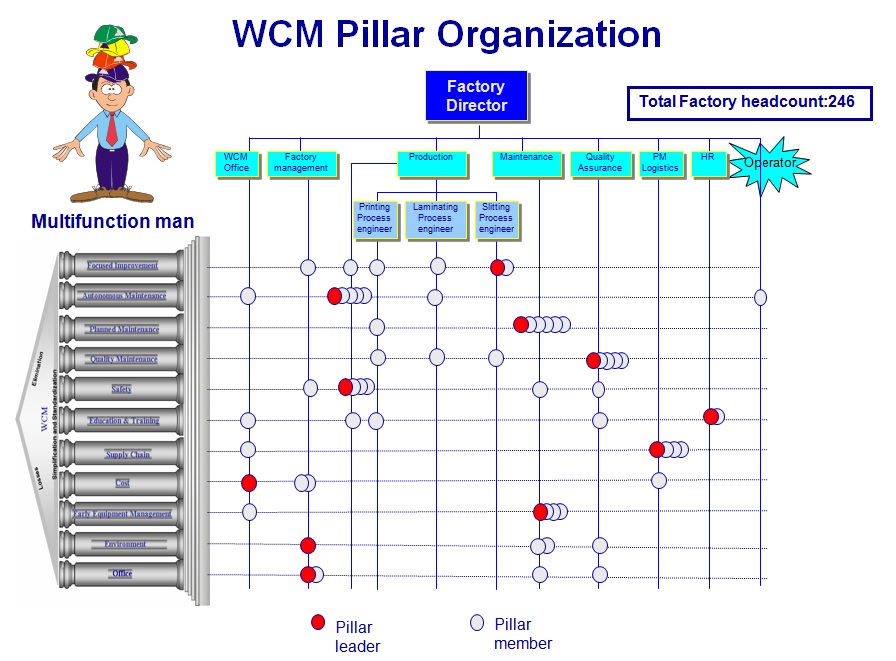
TPM: The introduction
The final competition of every industry is management. Advanced management is the key of morden enterprise to make lean production, improve effeciency, assure quality and optimize cost. The target of TPM is 0 accident, 0 defect, 0 breakdown. TPM (Total productive maintenance), the best level certificate of it is WCM (world class management) is the new chasing of morden manufacturing industry. All of the enterprises and plants, who want to be excellent, take it as the secret weapon to satisfy the customer by capacity, delivery, quality, cost, morale and environment through building WCM.
PILLAR 1-5S TPM starts with 5S. Problems cannot be clearly seen when the work place is unorganized.Cleaning and organizing the workplace helps the team to uncover problems. Making problems visible is the first step of improvement.
SEIRI—Sort outThis means sorting and organizing the items as critical, important, frequently used items,useless, or items that are not need as of now. Unwanted items can be salvaged. Critical itemsshould be kept for use nearby and items that are not be used in near future, should be storedin some place. For this step, the worth of the item should be decided based on utility and not cost.As a result of this step, the search time is reduced.
SEITON—OrganiseThe concept here is that “Each items has a place, and only one place”. The items shouldbe placed back after usage at the same place. To identify items easily, name plates and colouredtags has to be used. Vertical racks can be used for this purpose, and heavy items occupy thebottom position in the racks.
SEISO—Shine the WorkplaceThis involves cleaning the work place free of burrs, grease, oil, waste, scrap etc. No looselyhanging wires or oil leakage from machines.
SEIKETSU—StandardizationEmployees has to discuss together and decide on standards for keeping the work place/machines/pathways neat and clean. This standards are implemented for whole organization andare tested/inspected randomly.
SHITSUKE—Self-disciplineConsidering 5S as a way of life and bring about self-discipline among the employees of theorganization. This includes wearing badges, following work procedures, punctuality, dedication tothe organization etc.
PILLAR 2—JISHU HOZEN (AUTONOMOUS MAINTENANCE)This pillar is geared towards developing operators to be able to take care of small maintenancetasks, thus freeing up the skilled maintenance people to spend time on more value added activityand technical repairs. The operators are responsible for upkeep of their equipment to prevent itfrom deteriorating.Steps in JISHU HOZEN1. Train the employees: Educate the employees about TPM, its advantages, JH advantagesand steps in JH. Educate the employees about abnormalities in equipments.2. Initial cleanup of machinesSupervisor and technician should discuss and set a date for implementing step 1.Arrange all items needed for cleaning.On the arranged date, employees should clean the equipment completely with thehelp of maintenance department.Dust, stains, oils and grease has to be removed.Following are the things that have to be taken care while cleaning. They are oilleakage, loose wires, unfastened nits and bolts and worn out parts.After clean up problems are categorized and suitably tagged. White tags are placewhere operators can solve problems. Pink tag is placed where the aid of maintenancedepartment is needed.Contents of tag are transferred to a register.Make note of area, which were inaccessible.Finally close the open parts of the machine and run the machine.3. Counter measuresInaccessible regions had to be reached easily, e.g., if there are many screw to opena flywheel door, hinge door can be used. Instead of opening a door for inspectingthe machine, acrylic sheets can be used.To prevent work out of machine parts necessary action must be taken.Machine parts should be modified to prevent accumulation of dirt and dust.4. Tentative standardJH schedule has to be made and followed strictly.Schedule should be made regarding cleaning, inspection and lubrication and it alsoshould include details like when, what and how.5. General inspectionThe employees are trained in disciplines like pneumatics, electrical, hydraulics,lubricant and coolant, drives, bolts, nuts and safety.This is necessary to improve the technical skills of employees and to use inspectionmanuals correctly.After acquiring this new knowledge the employees should share this with others.By acquiring this new technical knowledge, the operators are now well aware ofmachine parts.6. Autonomous inspectionNew methods of cleaning and lubricating are used.Each employee prepares his own autonomous chart/schedule in consultation withsupervisor.Parts which have never given any problem or part which don’t need any inspectionare removed from list permanently based on experience.Including good quality machine parts. This avoid defects due to poor JH.•Inspection that is made in preventive maintenance is included in JH.The frequency of cleanup and inspection is reduced based on experience.7. StandardizationUp to the previous stem only the machinery/equipment was the concentration.However, in this step the surroundings of machinery are organized. Necessaryitems should be organized, such that there is no searching and searching time isreduced.Work environment is modified such that there is no difficulty in getting any item.Everybody should follow the work instructions strictly.Necessary spares for equipments is planned and procured.8. Autonomous managementOEE and OPE and other TPM targets must be achieved by continuous improvethrough Kaizen.PDCA (Plan, Do, Check and Act) cycle must be implemented for Kaizen.
PILLAR 3—KAIZEN‘Kai’ means change, and ‘Zen’ means good (for the better). Basically Kaizen is for smallimprovements, but carried out on a continual basis and involve all people in the organization.Kaizen is opposite to big spectacular innovations. Kaizen requires no or little investment. Theprinciple behind is that “a very large number of small improvements are more effective in anorganizational environment than a few improvements of large value.” This pillar is aimed atreducing losses in the workplace that affect our efficiencies. By using a detailed and thoroughprocedure we eliminate losses in a systematic method using various Kaizen tools. These activitiesare not limited to production areas and can be implemented in administrative areas as well.Kaizen Policy1.Practice concepts of zero losses in every sphere of activity.2.Relentless pursuit to achieve cost reduction targets in all resources.3.Relentless pursuit to improve overall plant equipment effectiveness.4.Extensive use of PM analysis as a tool for eliminating losses.5.Focus of easy handling of operators.Kaizen TargetAchieve and sustain zero loses with respect to minor stops, measurement and adjustments,defects and unavoidable downtimes. It also aims to achieve 30% manufacturing cost reduction.Tools used in Kaizen1.PM analysis2.Why-Why analysis3.Summary of losses4.Kaizen register5.Kaizen summary sheet.The objective of TPM is maximization of equipment effectiveness. TPM aims at maximizationof machine utilization and not merely machine availability maximization. As one of the pillars ofTPM activities, Kaizen pursues efficient equipment, operator and material and energy utilization,which is extremes of productivity and aims at achieving substantial effects. Kaizen activities tryto thoroughly eliminate 16 major losses.
16 Major Losses in a Organization
1.Failure losses—Breakdown loss2.Setup/adjustment losses3.Cutting blade loss4.Start up loss5.Minor stoppage/Idling loss6.Speed loss—operating at low speeds7.Defect/rework loss8.Scheduled downtime loss9.Management lossLosses that impede equipment efficiency10.Operating motion lossLosses that impede human work efficiency11.Line organization loss12.Logistic loss13.Measurement and adjustment loss14.Energy loss15.Die, jig and tool breakage lossLosses that impede effective use of16.Yield lossproduction resources.
PILLAR 4—PLANNED MAINTENANCEIt is aimed to have trouble free machines and equipments producing defect free products for totalcustomer satisfaction. This breaks maintenance down into 4 ‘families’ or groups, which wasdefined earlier.1.Preventive maintenance2.Breakdown maintenance3.Corrective maintenance4.Maintenance preventionWith planned maintenance, we evolve our efforts from a reactive to a proactive method anduse trained maintenance staff to help train the operators to better maintain their equipment.Policy1.Achieve and sustain availability of machines;2.Optimum maintenance cost;3.Reduces spares inventory; and4.Improve reliability and maintainability of machines.Target1.Zero equipment failure and breakdown;2.Improve reliability and maintainability by 50%;3.Reduce maintenance cost by 20%; and4.Ensure availability of spares all the time.Six Steps in Planned Maintenance1.Equipment evaluation and recoding present status;2.Restore deterioration and improve weakness;3.Building up information management system;4.Prepare time based information system, select equipment, parts and members and mapout plan;5.Prepare predictive maintenance system by introducing equipment diagnostic techniques;and6.Evaluation of planned maintenance.PILLAR 5—QUALITY MAINTENANCEIt is aimed towards customer delight through highest quality through defect free manufacturing.Focus is on eliminating non-conformances in a systematic manner, much like Focused Improvement.We gain understanding of what parts of the equipment affect product quality and begin toeliminate current quality concerns, then move to potential quality concerns. Transition is fromreactive to proactive (Quality Control to Quality Assurance).QM activities is to set equipment conditions that preclude quality defects, based on the basicconcept of maintaining perfect equipment to maintain perfect quality of products. The conditionsare checked and measure in time series to very that measure values are within standard valuesto prevent defects. The transition of measured values is watched to predict possibilities of defectsoccurring and to take counter measures before hand.Policy1.Defect free conditions and control of equipments;2.QM activities to support quality assurance;3.Focus of prevention of defects at source;4.Focus on poka-yoke (fool proof system);5.In-line detection and segregation of defects; and6.Effective implementation of operator quality assurance.Target1.Achieve and sustain customer complaints at zero;2.Reduce in-process defects by 50%; and3.Reduce cost of quality by 50%.Data RequirementsQuality defects are classified as customer end defects and in house defects. For customer-end data, we have to get data on:1.Customer end line rejection; and2.Field complaints.In-house, data include data related to products and data related to process.Data Related to Product1.Product-wise defects;2.Severity of the defect and its contribution—major/minor;3.Location of the defect with reference to the layout;4.Magnitude and frequency of its occurrence at each stage of measurement;5.Occurrence trend in beginning and the end of each production/process/changes (likepattern change, ladle/furnace lining etc.); and6.Occurrence trend with respect to restoration of breakdown/modifications/periodicalreplacement of quality components.Data Related to Processes1.The operating condition for individual sub-process related to men, method, material andmachine;2.The standard settings/conditions of the sub-process; and3.The actual record of the settings/conditions during the defect occurrence.
PILLAR 6—TRAININGIt is aimed to have multi-skilled revitalized employees whose morale is high and who has eagerto come to work and perform all required functions effectively and independently. Education isgiven to operators to upgrade their skill. It is not sufficient know only ‘Know-How’ by theyshould also learn ‘Know-Why’. By experience they gain, ‘Know-How’ to overcome a problemwhat to be done. This they do without knowing the root cause of the problem and why they aredoing so. Hence, it becomes necessary to train them on knowing ‘Know-Why’. The employeesshould be trained to achieve the four phases of skill. The goal is to create a factory full ofexperts. The different phase of skills is:Phase 1: Do not know.Phase 2: Know the theory but cannot do.Phase 3: Can do but cannot teach.Phase 4: Can do and also teach.Policy1.Focus on improvement of knowledge, skills and techniques;2.Creating a training environment for self-learning based on felt needs;3.Training curriculum/tools/assessment etc. conducive to employee revitalization; and4.Training to remove employee fatigue and make work enjoyable.Target1.Achieve and sustain downtime due to want men at zero on critical machines;2.Achieve and sustain zero losses due to lack of knowledge/skills/techniques; and3.Aim for 100% participation in suggestion scheme.Steps in Educating and Training Activities1.Setting policies and priorities and checking present status of education and training;2.Establish of training system for operation and maintenance skill upgradation;3.Training the employees for upgrading the operation and maintenance skills;4.Preparation of training calendar;5.Kick-off of the system for training; and6.Evaluation of activities and study of future approach.
PILLAR 7—OFFICE TPMOffice TPM should be started after activating four other pillars of TPM (JH, KK, QM,PM). Office TPM must be followed to improve productivity, efficiency in the administrativefunctions and identify and eliminate losses. This includes analyzing processes and procedurestowards increased office automation. Office TPM addresses twelve major losses. They are:1.Processing loss;2.Cost loss including in areas such as, procurement, accounts, marketing, sales leading tohigh inventories;3.Communication loss;4.Idle loss;5.Set-up loss;6.Accuracy loss;7.Office equipment breakdown;8.Communication channel breakdown, telephone and fax lines;9.Time spent on retrieval of information;10.Non availability of correct on-line stock status;11.Customer complaints due to logistics; and12.Expenses on emergency dispatches/purchases.Office TPM and its Benefits1.Involvement of all people in support functions for focusing on better plant performance;2.Better utilized work area;3.Reduce repetitive work;4.Reduced inventory levels in all parts of the supply chain;5.Reduced administrative costs;6.Reduced inventory carrying cost;7.Reduction in number of files;8.Reduction of overhead costs (to include cost of non-production/non-capital equipment);9.Productivity of people in support functions;10.Reduction in breakdown of office equipment;11.Reduction of customer complaints due to logistics;12.Reduction in expenses due to emergency dispatches/purchases;13.Reduced manpower; and14.Clean and pleasant work environment.
PILLAR 8—SAFETY, HEALTH AND ENVIRONMENTTarget1.Zero accident,2.Zero health damage, and3.Zero fires.In this area focus is on to create a safe workplace and a surrounding area that is notdamaged by our process or procedures. This pillar will play an active role in each of the otherpillars on a regular basis.A committee is constituted for this pillar, which comprises representative of officers as wellas workers. The committee is headed by senior vice President (Technical). Utmost importanceto safety is given in the plant. Manager (safety) is looking after functions related to safety. Tocreate awareness among employees various competitions like safety slogans, quiz, drama, posters,etc. related to safety can be organized at regular intervals.Today, with competition in industry at an all time high, TPM may be the only thing thatstands between success and total failure for some companies. It has been proven to be a programthat works. It can be adapted to work not only in industrial plants, but also in construction, buildingmaintenance, transportation, and in a variety of other situations. Employees must be educated andconvinced that TPM is not just another ‘program of the month’ and that management is totallycommitted to the program and the extended time frame necessary for full implementation. Ifeveryone involved in a TPM program does his or her part, an unusually high rate of returncompared to resources invested may be expected.
General route of TPM
Generally, all of the TPM pillars can be deployed according to the following displayed pictures with the detailed information being different. 1,Understand the operation situation to map the value chain or structure; 2, Prioritise the non-necessary activities; 3,Seletct the proper sub route such as maitenance, quality etc. 4, Use Pareto to prioritizing critical area; 5, Skills analysis of restoring basic condition including calculating maintenance schedule; 6, Basic skill matrix; 7, Execute basic clean, lubrication and inspection; 8, Executive variation analysis and re-training 9, Chronic losses analysis 10, Advanced skill matrix 11, Advanced CIL 12, condition management.
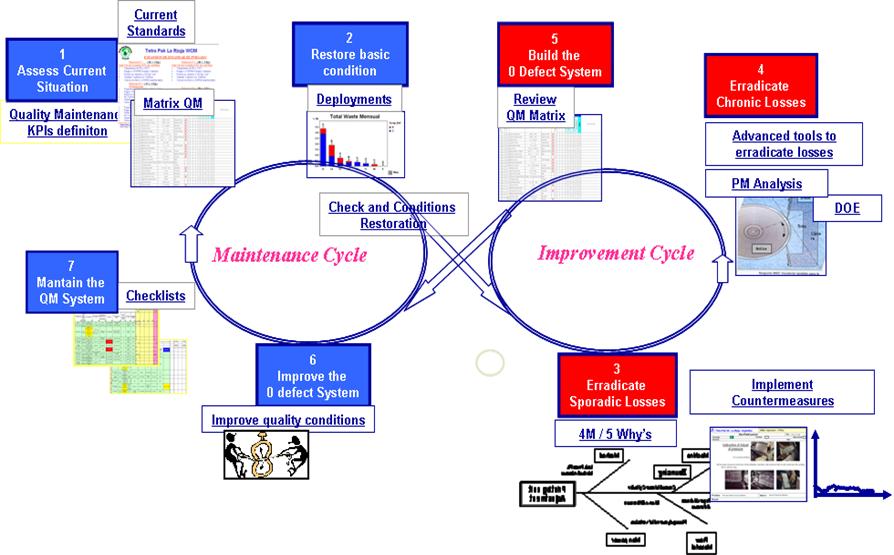
TPM: The philosophy and Evolution phases
Philosophy
TPM aims at using equipments to its maximum and aids in reducing life cycle costs (LCC). In other words going all out to eliminate the Losses (Waste) cased by the equipment.
TPM improves work activities that deal with equipment Set-up, Operaing parameters, Maintenance, Tear down, Repairs and Breakdowns etc.
It specifically aims at the complete elimination of the "six major losses" while strving for a goal of zero unscheduled downtime, Zero defect and Zero accident.
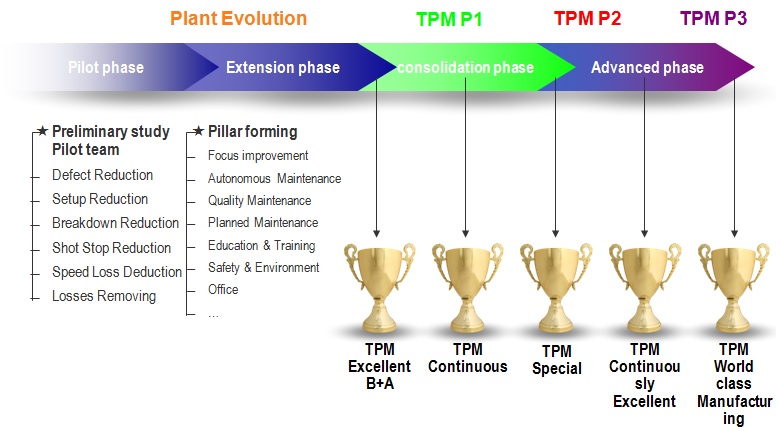
Pilot phase
Pilot phase is the start of the journey, it lasts 6 months normally.
Pilot teams are formed to attack some of the critical problems of the company.
The company starts the process of driving the system from targets.
Target of pilot teams
Start people involvement.
Practise method on how to improve.
Obtain significant results on important issues for the company (Minimum target 50%).
At the end of the pilots, many potential TPM leaders are trained for the future teams.
3 Key words
Involvement
Method
Result
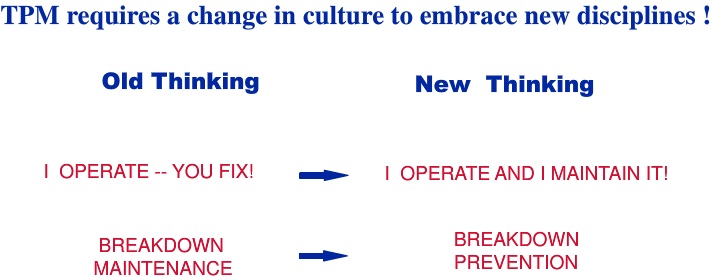
Why does the enterprise need TPM?
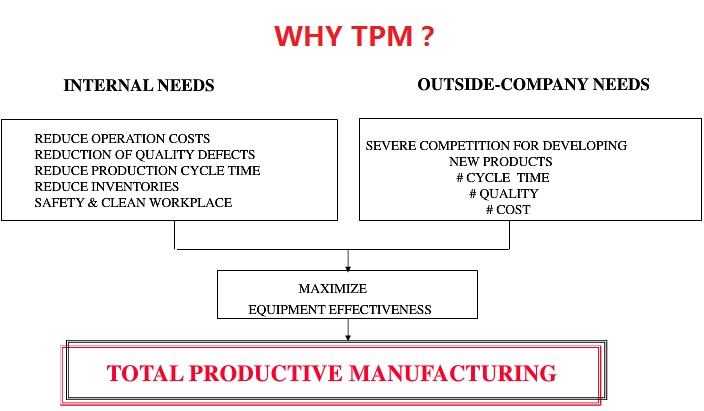
Through TPM, we can
- Maximize equipment effectiveness.
- Develop a system of productive maintenance that plan, design, use or maintain equipment in implementing TPM.
- Actively involve manufacturing specialists.
- Reduce waste or losses.
- Increase utilization of employee knowledge and skills.
- Improve product quality and consistency.
With the definite target being as the followings,
0 unplanned downtime
0 speed losses including asset idle time
0 defects
0 accidents
Minimum life cycle cost of asset.
And the general target of TPM is OEE which is the abbreviation of total equipment effectiveness.
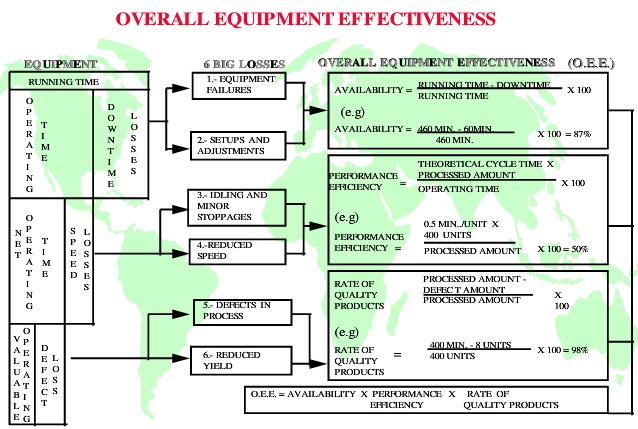
WCM: Terms and definitions
OCE to measure the personnel performance?
Two perspectives of people performance are skill and attitude. KPI of skill is OCE (Overall contribution effeciency), or APQMIS,which is the abbreviation of Availability, Performance, Quality, Maitenance and improvement, Sustainability.
Generally, the skill KPI measurement can be deployed according to the steps in the followings:
A, Are the people available?
P, Have people perfromed?
Q, Time used enough?
MI, Production situation improved?
S, Level is suatainable or not?
For example:
A,If we have 100 time units in which the on duty time is 80 units, we can get the availability being 80/100 which equals 80%;
P,After the people is on duty or they come to company or working unit, they take 5 time units to attend training, 2.5 units standing by, 2.5 units preparing work reports and then do the normal activity work, the performance will be: P=(80-5-2.5-2.5)/80=87.5%;
Q,Let us presume the time usage rate being 90%;
MI,If MME before maintenance is 99% with post-Maintenance MME being 94%, then MI is 100%-(99%-94%)=95%;
S,We can use standard deviation to measure the sustainability of the people. For example, if it is 5, then S=(100-5)/100=95%;
so we get that OCE=80%*87.5%*90%*95%*95%=56.86%
We can see that it is very difficult to get a high OCE.
OEE
Before you get stressed out with your company’s productivity or the lack thereof, you have to assess what you’re missing. Every company has it, may it be ineffective marketing strategy, disorderly organization, unproductive equipment etc. If you’re having problems with the hardware or equipment used by the firm for manufacturing then a good system is needed to be put in place. This is the moment when smoothly operating equipment is crucial to make substantial returns for the company.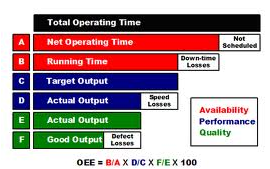
Many experts believe that a lot of processes employ machines to add value to what clients pay for and this is true in a setting that is widely competitive. For instance, a toy company that produces thousands of products daily for the local and international market requires factory machines to work dependably and at their optimum pace to supply products when customers or the industry needs them. But it’s evident that factories throughout the globe are plagued with equipment problems of one kind or another. So it’s essential that company owners understand and evaluate their business’ Overall Equipment Effectiveness or its OEE. Generally, OEE measures how well the equipment is running. It can specifically show how much of the time the machine is actually doing well and what percentage or portion of the output is of good quality, not just the amount of products or output the machine is turning out.
What’s more, OEE is not just for maintenance anymore since the approach can help predict problems in the future and may allow some monitoring of the equipment’s health as well. It involves a step-by-step computation which is part of the general framework. Of course, if you want to know more about the system and how it mainly works then consulting experienced trainers or consultants is the best way to understand the key components and its application.
OLE
OLE is the abbreviation of overall labor effectiveness which is a very effective performance index to measure the people performance especially for low level persons whose salary is based on working unit such as 0.3 euro per loading one pallete or 0.1 $ per folding one box etc. And the maintemance work is also treated as this theory recently such as 3 $ per motor change or 2100 $ for one third party contract overhall etc. If treat such human resources supplier or department as one unit, we can meaure every human resource effectiveness easily using OLE.
When such a person is hired to maintain the machines effectiveness, for example, mechanical machine effeciency or MME, then the theory time the person can work 100% is hiring time or solar time somebody called. Of couse he has some time to leave for holidays or sickness etc. which is treated as absent time. And he also needs training, feeding and travel etc which is called setup time.
Then OLE of such person is calculated as the followings,
Availability=(Solar time-absent time)/Solar time
Performance=(Solar time-absent time-setup time)/(Solar time-absent time)
Quality=Weighted MME*(Solar time-absent time-setup time-service cost per 000 litre/allowance per time unit)/(Solar time-absent time-setup time)
OLE=A*P*Q
PM analysis
PM analysis


Eradicate the abnormality.
Project management
1.Pilot management
Understand current situation (UCS) & target definition
Method (Pillar & Route)
Line programming(Measure & control)
Resources & Plan
Implementation & audit
2.Horizontal & Vertical Rollout management
Region rollout
Region audit
3.Sytem improvement & summary
What is PKE?
PKE stands for Process Kaizen Engineering, where
Kaizen= continuous improvements
The PKE is therefore the Engineer for Continuous Improvement.

What is TPM?
TPM is the abbreviation of total productive manufacturing.
It is not just a program. It is a long term production efficiency improvement process to attain a predictable manufacturing environment.
Through total involvement of the entire workforce, the quality of product and machine uptime can be improved by continuously improving the equipment performance. TPM can also reduce total production and maintenance costs.
WCM: The deployment of pillars
Requires 100000 POINTS in the General category.Cost reduction pillar
MISSION:
To support the right decision concerning cost. Providing production cost risk analysis, identifying action to prevent cost increase, defining cost management policies and mapping investments and Kaizen activities priorities.

STRATEGY :
2. Achieve total processing cost target
Cost pillar audit
Methodology
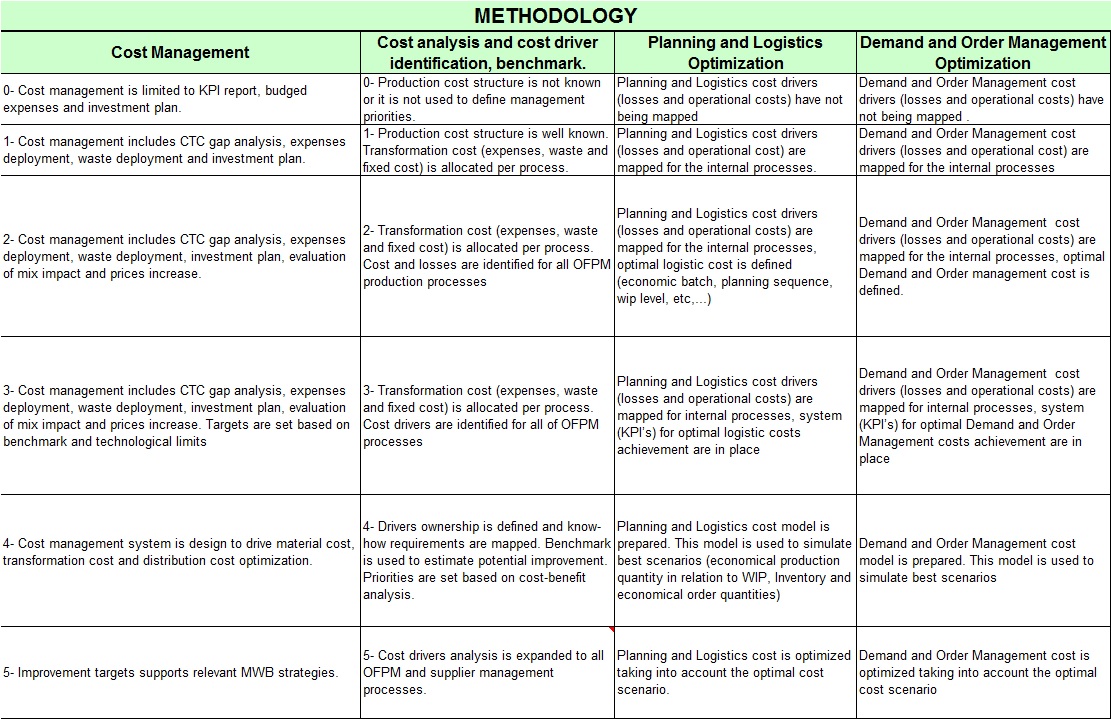
Progression and result
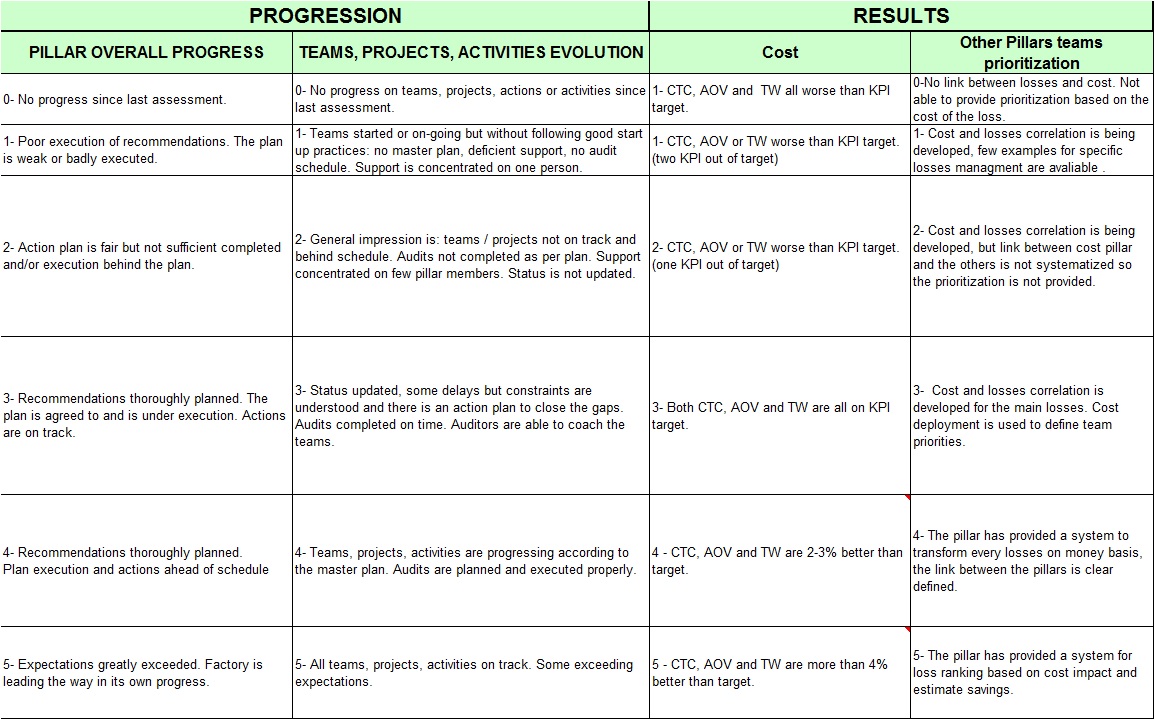
Cost pillar target
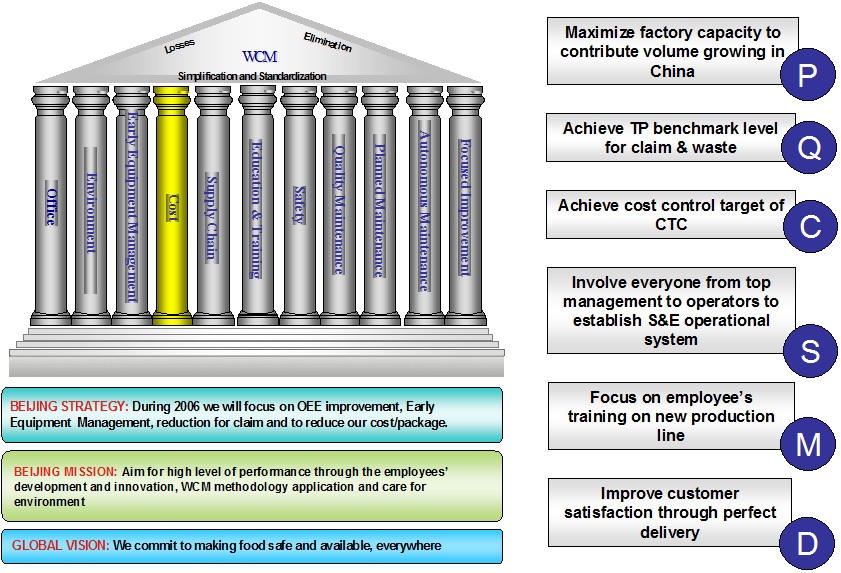
Cost pillar target achievement
Education and training
Basic step: 1, Evaluate situation and strategy; 2, Idetify training needs; 3, Training and appraisal.

If Man-Method losses need to be reduced, an E & T team should be awaken.
Advanced E&T pillar
Requires 100000 POINTS in the General category.Education and training audit
Requires 60000 POINTS in the General category.Skill matrix template
This is only part of the skill matrix. We develop skill matrix for PM pillar, AM pillar, QM pillar etc. If you'd like more information or support, please contact macrolake management.
What is E & T role? RACI
Responsible - Those who do work to achieve the task. There can be multiple resources responsible.
Accountable - (Also Approver) The resource ultimately answerable for the correct and thorough completion of the task. There must be exactly one A specified for each task.
Consulted - Those whose opinions are sought. Two-way communication.
Informed - Those who are kept up-to-date on progress. One-way communication.
When and how launch an E&T team?
When should we launch an E&T team?
When Man & Method losses need to be reduced.
When should we not launch an E&T team?
When training is not relevant to Man & Method losses.
Training objective is to increase awareness
Training method is distributing OPLs only.
Environment impact reduction
STRATEGY :
To optimize environmental conditions, reduce energy consumption and improve EPIs.
MISSION:
Establish Environmental management system to reduce energy consumption and make sure to achieve 100% waste recycling.
Committed to the following environmental policy:
- Follow all applicable global, national and local legislation and regulations when it comes to environmental protection.
- Maintain ISO14001 system, which ensures continual improvement in the aspects of environmental performance. - Manages waste properly, including maximizing recycling of factory waste.
- Formulate and improve the environmental objectives to make efficient use of resources and to minimize the environmental pollution.
- Ensure all staff understand and follow legislation and our environmental system and are well informed about our environmental affairs.
Environment impact reduction audit
Requires 6000 POINTS in the General category.Quality maintenance Pillar
 Zero Defect