


Determine the fair value of 1,000 shares of a public company's stock by using the Internet or a major newspaper to find the last closing share price for the stock. For example, if the stock closed at a price per share of $50 yesterday, then the fair value of 1,000 shares is 1,000 x 50 = $50,000.
Asset Management
English
Forums:
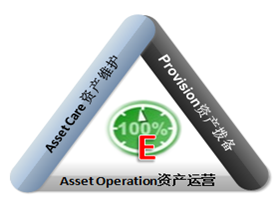
What is Asset Management ? Through systematic asset providing, caring and operating, optimise the life cycle of assets to assure the competitiveness of one enterprise.
OEE or TCU is often used as one index to measure or trigger asset provision and operation, PTU is the measurement of maintenance and operation level of equipments, and MME, MTBF, MTTR, TBM or CBM based maintenance method vs corrective maintenance method, spare parts consumption and relevant service cost are the indicators of asset care or maintenance level . OEE or TEEP, Activity based operational cost, production time per unit product, waste per unit product or utilities per unit product and etc. are often the indicators of operational level of one enterprise or plant.
−Systematic and coordinated activities and practices through which an organization optimally manages its assets, and their associated performance, risks and expenditures over their lifecycle for the purpose of achieving its organizational strategic plan.
−The optimum way of managing assets to achieve a desired and sustainable outcome.
7 areas of ISO 55000 Requirement
1,Organizational context: The policy and strategy of one company. What are the pains or expectations of stakeholders or AM relevant people. Short term, medium term and long term vision or policy of AM, Gaps and priorities of AM, AM scorcard: KPIs and targets, AM master plan (1 year). The relevant supportive 1) strategical, 2) financial, 3) risk and 4) life cycle management should exist.
2,Leadership:To define the organizations, roles, responsibilities (related to asset management) and performance management. Assure 1) strategy, 2) organization and development, 3) contractor management and 4) operator asset care are properly executed in structure.
3,Planning:To develop a strategic plan for asset management in line with the policy and objectives. Establish systems and tools to facilitate organisational planning.Establish systems, tools and processes to ensure the longevity of the assets. The activities include: 1) Develop risk evaluation and identification methodology and reporting requirements. 2) Walk down the asset base recording all applicable attributes. 3) Evaluate asset register for criticality based on enterprise developed criticality criteria. 4) Apply asset care plan development process to applicable (high criticality assets). 5) Formulate the strategic activities (short, medium and longer term) required to meet the organisational strategic objectives through the asset management plan. There are three categories of key deliverables which include risk management, planning for asstes and asset management planning. Risk management includes Risk Evaluation Process, Risk matrix and Risk register complete for plant. Planning for asstes include Comprehensive Asset Register, Asset Criticality matrix, Asset Care Plan development guide and Asset Care plans for critical assets (top 10%). Asset management planning includes Asset Management Strategy, Asset Management Plan and Asset provision and life cycle management. So 1) strategy management, 2) information management such as supportive SAP system to support correct, quick and systematic data, 3) technical information, 4) Financial management, risk management, 5) asset care plan, 6) work planning and control, 7) material management and 8) life cycle management of asset are covered in this area.
3,Planning:To develop a strategic plan for asset management in line with the policy and objectives. Establish systems and tools to facilitate organisational planning.Establish systems, tools and processes to ensure the longevity of the assets. The activities include: 1) Develop risk evaluation and identification methodology and reporting requirements. 2) Walk down the asset base recording all applicable attributes. 3) Evaluate asset register for criticality based on enterprise developed criticality criteria. 4) Apply asset care plan development process to applicable (high criticality assets). 5) Formulate the strategic activities (short, medium and longer term) required to meet the organisational strategic objectives through the asset management plan. There are three categories of key deliverables which include risk management, planning for asstes and asset management planning. Risk management includes Risk Evaluation Process, Risk matrix and Risk register complete for plant. Planning for asstes include Comprehensive Asset Register, Asset Criticality matrix, Asset Care Plan development guide and Asset Care plans for critical assets (top 10%). Asset management planning includes Asset Management Strategy, Asset Management Plan and Asset provision and life cycle management. So 1) strategy management, 2) information management such as supportive SAP system to support correct, quick and systematic data, 3) technical information, 4) Financial management, risk management, 5) asset care plan, 6) work planning and control, 7) material management and 8) life cycle management of asset are covered in this area.
4,Support:The asset management function should receive support from all other parts of the organization. Marshaling this such support and applying, verifying and improving it is an objective of the asset management system. The processes of the asset management system should determine and provide the information needed to fulfil the strategic plan through a formalised approach. Main activities include 1) Identify appropriate organisational competencies and the training requirements, 2) Establish maturity appropriate communication mechanisms through workshops and technology, 3) Build one information platform to collect relevant data, report and manage assets, 4) Workshop and develop a management of change business process. There are 5 categories of key deliverables including Competence, Awareness & Communication, Information System, Document Management and Governance of AM System (•Management of Change process). Competence includes Training Matrix & Plan, Development Plans and Capability Matrix. Awareness & Communication includes Asset Management Induction program and Communication Strategy. It covers 1) information management, 2) technical information, 3) organization development, 4) contractor management, 5) Financial management, 6) risk management, 7) Enviroment, health and safety, 8) support facilities and tools and 9) project and shutdown management.
5,Operation:The asset management system should enable the organisation to direct, implement and control its asset management activities, including those that have been outsourced. Establish a mechanism to evaluate potential and actual changes with respect to the risk profile and to instigate mitigating actions. Main activities: 1) Review current work planning and scheduling processes and tools for maintenance activities and optimise them in line with developed asset management plans. 2) Establish processes to identify, review and manage changes. 3) Review current contractor management processes and procedures with a view to optimise them. 4) Develop a contracting matrix. and 5) Review and evaluate current stock management systems and processes and recommend improved management methods. It covers 1) contractor management, 2) work planning and control, 3) operator asset care and 4) support facilities and tools.
6,Performance Evaluation:To establish a balanced set of measures that can be applied to the entire organisation at all levels.To provide an accurate set of data against which informed asset management decisions can be taken. It covers 1) performance evaluation, 2) information management, 3) technical information, 4) life cycle management, 5) performance measurement and 6) focused improvement.
7,Improvement:Organization needs to consider nonconformities, and their associated consequences, in its assets, asset management and the its asset management system. The asset management system should promote continual improvement, to ensure the suitability, adequacy and effectiveness of the asset management system and asset management. Continual improvement is most effective when it is proactive and uses the results of performance evaluations. It covers 1) asset care plans, 2) work planning and control and 3) focused improvement.
About us
 Macrolake supplies machines and facilities of aseptic production.
Welcome to join us (As hands-off supplier, Joint store owner, article writer or our employee etc.) and you can also upload resources including commodities display in joint store, videos, musics and comments etc.
The people who upload information will get user points which can be cashed, or used to shop in points store.
ADDRESS: UNIT 17, 9/F., TOWER A, NEW MANDARIN PLAZA, NO.14 SCIENCE MUSEUM ROAD, TSIMSHATSUI, KOWLOON. 24/7 Email:service@macrolake.com; QQ:VIP691623989;
24/7 Tel: +00852 30623052 +086 13911120825 +086 13901362451; WeChat:VIP691623989
If anything found ruins intellectual property, please contact us.
English
Macrolake Crackers
MACROLAKE cultivates, produces and trades organic foods, advocates high quality life and good society, protects green earth and makes the ecological environment cycle continuously and organically.
Macrolake Shrimp strips1-1000g: USD 2.4 (Macrolake Shrimp is organic food.)
English
Macrolake consultancy
Macrolake serves opertional excellence solution for Organization.
English
Macrolake Pyramid operation model
If your enterprise wants to be excellent, the core is to arm your people with skills.
So you can use KBI (Key behavior index) and KPI (Key performance index) to monitor both the behavior and the performance of your staff.
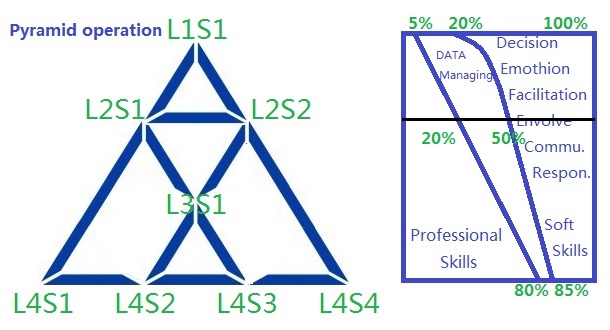
And you are brave enough to take the responsibility of developing them. You advocate the Pyramid operation thoery that the leader's performance and behavior score should be his subordinates' average plus his own.
For example, if your score is L1S1 and you have two subordinates whose scores are L2S1 and L2S2 respectively. Professional skill score of the subordinate with score being L2S1 is PSS21, Data managing score is DMS21, and soft skill score is SSS21. Then L2S1=PSS21*(20%-0%)+DMS21*(50%-20%)+SSS21*(100%-50%).
L1S1=(PSS21*5%+DMS21*(20%-5%)+PSS22*5%+DMS22*(20%-5%))/2+SSS11*(100%-20%), because leader's soft skill weight is higher than his suborbinates, the soft skill score use leader's own but not his subordinate's.
L2S1 or L2S2 score comes from two perepectives which are skill matrix score or KBI ones and KPI ones. Generally the weight of KBI is from 20-40% and KPI is from 80% to 60%.
English
Macrolake infinite improvement
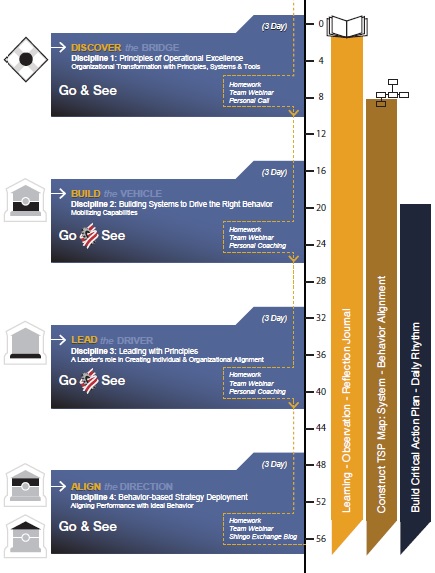
- Describe the benefits of focusing on principles
- Articulate principle-driven behavior
- Identify how tools link to systems
- See and assess behavior to provide constructive feedback
- Explore what adjustments could be made to improve systems in driving ideal behavior
- Select high impact systems to drive ideal behavior
- Scientifically Experiment with adjusting systems
- Re-align systems to eliminate work-a-rounds/fire-fighting
- Build system reliability - monit or behavior
- Clarify teaching role: when to mentor, coach, lecture
- Unify the learning and teaching cycles
- Ask questions that inspire an d motivate
- Unleash talent and passion
- Create a workforce that engages in continuous improvement
- Translate your desired culture into specific behaviors
- Monitor behavior (KBI) an d performanc e (KPI)
- Align and measure the execution of YOUR strategy
- Create a visual map to align and adjust your culture
- Identify key roles and responsibility to manage your culture
English
Principle House of Macrolake Lean
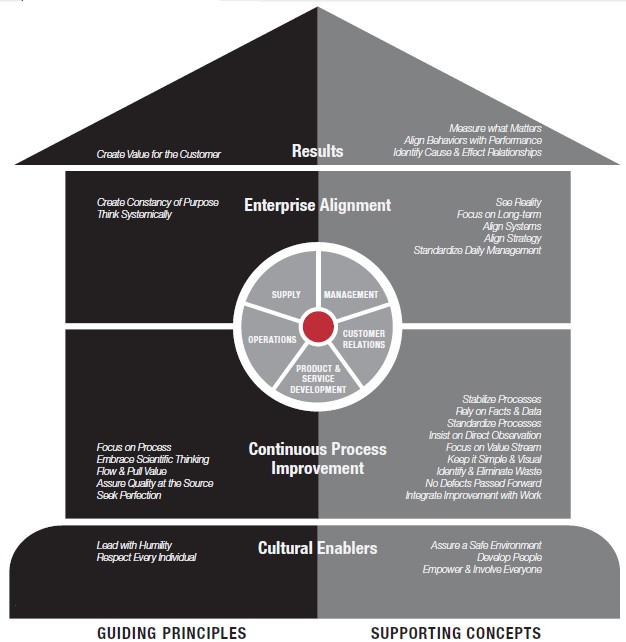
Principles of Operational Excellence (The Macrolake House)
“Think in terms of categorical principles.” The Macrolake House is a categorization of the guiding principles of operational excellence. Associated with each category are also listed many important supporting concepts. The principles are categorized into four dimensions: cultural enablers, continuous process improvement, enterprise alignment, and results – the ultimate end of all business initiatives. These four dimensions overlay five core business systems: product/service development, customer relations, operations, supply, and a variety of management or administrative support systems.
 Guiding Principles
The Macrolake Lean for Operational Excellence did not create the 10 guiding principles of operational excellence, but rather they have always existed. In truth, there is ample evidence that these principles have been well understood, more or less, at different times for thousands of years. As the world has gone through cycles of advancement and decline, it seems these principles are routinely lost and forgotten and must be re-discovered. Emerging from the dark ages into a period of enlightenment and industrialization, the impact of these principles are only now beginning to be understood again.Certainly, and even surprisingly, most companies do not emphasize these principles even though they are the driver for business execution excellence. The cause for this may be that these fundamental business principles have been lost in management fads and tool boxes that become programs or “flavors of the month.” The Macrolake Lean for Operational Excellence has made a diligent search of thought leaders over the last 100 years. Their work has been carefully analyzed and dissected and the unique concepts or principles from each have been extracted. Compiling, distilling, and prioritizing the list led to the 10 guiding principles on the left side of the house and the supporting concepts for each dimension on the right side. Supporting concepts are critical to pay attention to but may not stand up to the rigor of being universal, timeless, and selfevident like the guiding principles. The dimensions are the result of “thinking categorically about the principles.” It is clear that all four dimensions of the model require focus in order to achieve excellence. In the same way that we need to comprehend objects in three dimensions to truly appreciate all of their characteristics, operational excellence must be viewed in these four dimensions in order to fully appreciate the power of the principles to affect business outcomes.
English
Transforming a Culture by Macrolake transformation square
Transforming a Culture (Macrolake Transformation Process)
Many organizations and their leaders are coming to understand that sustainability requires focusing on the culture; that’s the easy part. The difficult part is in knowing how to really affect change.The Macrolake transformation process is a methodology for accelerating a personal and enterprise-wide transformation to a culture of operational excellence. The process is based on the teaching of Macrolake who recognized that business improvement comes through understanding the relationship between principles, systems, and tools.
Macrolake understood that operational excellence is not achieved by superficial imitation or the isolated and random use of tools and techniques (“know how’”). Instead, achieving operational excellence requires people to
“know why” (i.e., an understanding of underlying principles.)
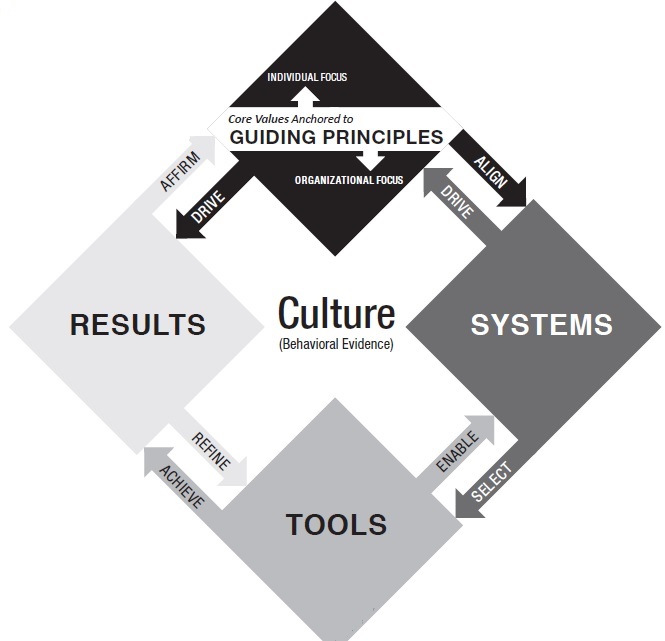 In the 1940s, the work of French social scientist, Jean Piaget, led us to understand that learning occurs when people come to deeply understand the meaning behind the methodology. People naturally search first for meaning, the principle, and then attempt to organize them somehow into a system, or some kind of order. Finally, they create tools to better enable the systems to accomplish the purpose for which they were created.
Learning and Teaching the Principles
The first step a leader must take in leading cultural transformation is a personal journey to understand what each of these guiding principles mean conceptually and then what they mean personally. It is impossible for a leader to lead the development of a principle based culture until he or she has gone through the deep personal reflection required to begin a cultural transformation. This is no trivial task. For many and perhaps most, fully embracing these principles requires a fundamental rethinking of the rules of engagement used to get to where they are.
At a minimum, leaders must be curious enough to experiment with the principle. John Shook at the Lean Enterprise Institute taught us that it is often impossible to “think our way into a new way of acting.” Rather, guided by correct principles, one may do, observe, learn, and then do something else until we “act our way into a new way of thinking.” By carefully analyzing the cause-and effect relationship between principles and results, a leader will begin to shift their own beliefs about what drives optimal business performance. After gaining this new insight it becomes the effective leader’s primary responsibility to see that others in his/her organization have experiences where they can gain the same insight.
Leaders who choose to disregard the principles that govern business outcomes do so at great peril. Whether we acknowledge them or not, the principles of operational excellence always govern the consequence of our leadership and management behaviors. An example may help. If we encourage, enable, or simply allow a culture to emerge where employees are thought of merely as an unfortunate cost burden or that the smartest people are those that rise to the top, the consequence will be a workforce that is not fully engaged. Ideas for improvement are never articulated and acted on, people feel unfulfilled in their work, and turnover is very high. Labor costs become xcessively high, business systems stagnate, and innovation is not fast enough to compete in a rapidly changing business climate. Unwise leaders see this as a validation of what they believed rather than the disappointing end of a self-fulfilling prophesy.
When people understand principles for themselves, the “why,” they become empowered to take personal initiative. Leaders who teach associates the principles behind the tactics or the tools can be confident that innovation from each individual will be pointed in the right direction. It is not necessary for a leader to define ideal behaviors for others. If the principle is truly a principle, people with different values will readily be able to define ideal behavior for themselves and over time, behaviors become consistent even in a diverse environment.
Macrolake understood this and taught that the primary role of a leader is to drive the principles of operational excellence into the culture. When leaders precisely define the detailed and expected behaviors for others, resentment
builds. It conveys mistrust and makes people feel incompetent.
Aligning the Systems with Principles
All work in organizations is the outcome of a system. Systems are either designed to produce a specific end goal or they evolve on their own. Systems drive the behavior of people or rather they create the conditions that cause people to behave in a certain way. One of the outcomes of poorly designed systems is enormous variation in behavior, or even consistently bad behavior. Variation in behavior leads to variation in results. Operational excellence requires ideal behavior that translates into consistent and ideal results.
The Macrolake transformation process illustrates the critical need to align every business, management, and work system of the organization with the principles of operational excellence. When systems are properly aligned
with principles, they strategically influence people’s behavior toward the ideal.
Macrolake also taught that the primary role of managers must shift from firefighting to designing, aligning, and improving systems.
The Enabling Role of Improvement Tools
A tool is nothing more than a point solution or a specific means to a specific end. Macrolake referred to tools as techniques for problem solving, necessary but not sufficient. We taught that tools should be selected to enable a system to perform its intended purpose. In many ways, a system may be thought of as a collection of tools working together to accomplish an intended outcome. A successful enterprise is usually made up of complex business systems that can be further divided into layers of sub-systems, each having embedded in them the necessary tools to enable the successful outcome of the system.
Perhaps the largest mistake made by corporations over the last three or four decades has been the inappropriate focus on a specific tool-set as the basis for their improvement efforts. Tools do not answer the question of “why,” only the question of “how.” Knowing the “how” without understanding fully the “why,” leaves people waiting for instructions and powerless to act on their own.
Powerful organizations are made up of powerful people who understand the principles that govern their successful contribution.
Organizations can never sufficiently release the full potential of their people by creating a tool-oriented culture.
Experiment with the Principle
One of the principles of operational excellence is scientific thinking, which is intended to foster a culture of experimentation and deep learning. People must be able to put to test each of the principles espoused by the principle based leader. Only when people see for themselves the cause-and-effect relationship of results relative to the principle, will they come to deeply and personally understand the value of the principle to themselves. Repetition through many cycles of learning in the experiment gives people a personal insight about the principle and empowers them to make personal judgments about its validity.
English
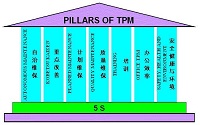
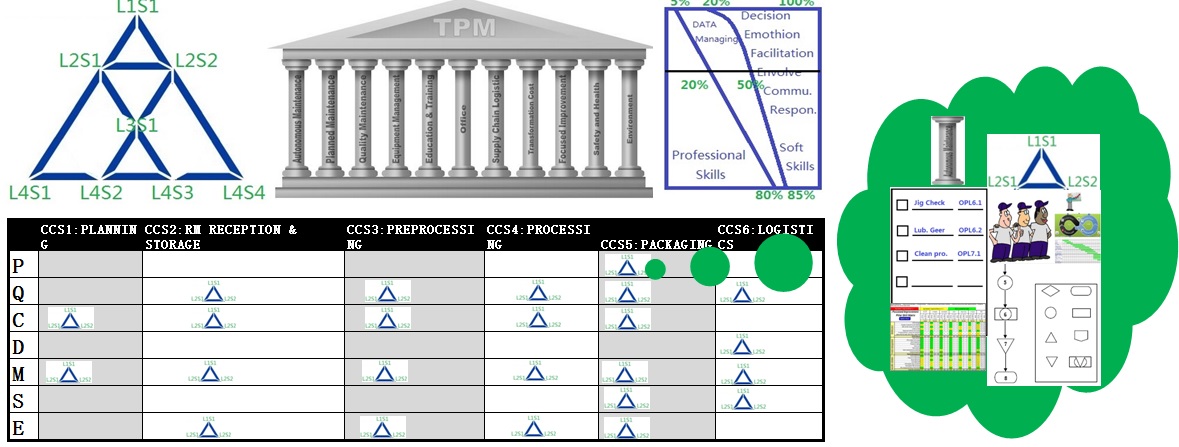
Macrolake team oriented TPM deployment model
English
Engage your member with team

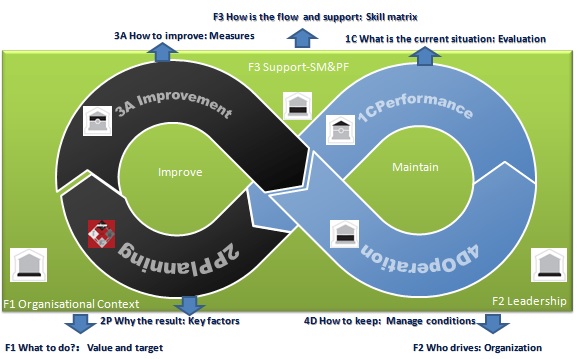
F1: Let your member understand his value in team pillars using flow chart, try to transform his activities to his individual KPIs.
F2: Let your member understand his roles in teams, link his KPIs with the teams'.
F3: Map his skills (SOPs and OPLs) by linking them to his KPIs. Record his activities or skill results by CIL sheet. Monitor and maintain his KPIs.
1C: Check the trend of his KPIs; Test the effectiveness and correlation of his skills with his KPIs. Test the correlation of his KPIs with the team's KPIs.
2p: Maintain or optimize his skills, CIL activities record and KPIs trend by using critical factors analysis & counter-measures recommendations.
3A: Train measures and form the new skills. Add the skill activities into his CIL record forms.
4D: Analyze the criticalities (CCP control) of your member's activities by linking them with every process point through flow chat and carry out the CIL activities and record. Maintain and improve your team's KPI trend.
English
Meng Niu Dairy in China got ISO55001 certification
Through several years' cooperation with Macrolake consultancy, Meng Niu Dairy got the certification of ISO 55001 on the 16th April, 2015. This is the first ISO 55001 certification in Asia and the 7th in the world.
The target of this project is to maximize the value of assets with 3 KPIs including asset efficiency (OEE), operational cost saving and energy saving.
Through asset provision, operation and maintenance, especially disposal of overage service asset using NPV cash creation capability, potential cost saving is more than 0.8 billion RMB in 10 production year.
English
Macrolake intelligent manufacturing & M2M technology
Solution for smart building and society.

When smart things everywhere are connected together, we will be able to do more and be more. This is the Internet of Everything (IoE) or machine to machine (M2M), a paradigm shift that marks a new era of opportunity for everyone, from consumers and businesses to cities and governments.
IoE/M2M is changing our world, but its effect on daily life will be most profound. We will move through our days and nights surrounded by connectivity that intelligently responds to what we need and want—what we call the Digital Sixth Sense. Dynamic and intuitive, this experience will feel like a natural extension of our own abilities. We will be able to discover, accomplish and enjoy more. We are creating the fabric of IoE/M2M for everyone everywhere to enable this Digital Sixth Sense.
How will the IoE/M2M happen? Key elements that make it real are already here. Powerful smartphones are a natural tool to deliver IoE experiences. And wireless networks, a fundamental layer of IoE/M2M connectivity, are integrated around the globe. Those elements are ready for everyone to leverage, and we are making that easier than ever.
As a leader, we have an unmatched portfolio of visionary solutions that deliver the connectivity and communication needed to support the IoE/M2M opportunity industry-wide. As a partner, we enable and amplifiy other companies’ IoE/M2M product and service innovations. Together, we are bringing IoE/M2M forward faster, making the Digital Sixth Sense a natural extension of how we work and play.
English
3 in 1 laser welding machine for welding cleaning and cutting 2000w
Packages: BWT fiber laser source focused on small and medium power laser, Handheld Welding Gun with Pure copper welding nozzle, Built-in Water-Cooling system, 10-meter brand optical fiber and Auto Wire Feeder.
Efficiency: Efficiency is about 5 times argon arc welding. Laser welding machine offers high accuracy, allowing for precise control. Laser welder produces a small heat-affected zone (HAZ) compared to traditional welding methods which reduces the risk of distortion or damage to the surrounding material. It also saves energy.
Accuracy welding: Laser welding machine offers a non-contact process meaning that the laser beam does not physically touch the workpiece. This eliminates the risk of contamination or damage to the materials being welded. Handheld laser welding machine also allows for welding in hard-to-reach areas or complex geometries such as the welding in cabinets and kitchens etc.
Multi-purpose: Portable Laser Welding Machine can realize straight seam welding, spot welding, circumferential welding, overlap welding etc.
Service: Easily operated by unskilled People and we provide Lifetime online technical support.
English
$12,804.64
Product category:
图像:

Stock:
1 000
M2M makes internet of everything
English
Forums:
When smart things everywhere are connected together, we will be able to do more and be more. This is the Internet of Everything (IoE) or machine to machine (M2M), a paradigm shift that marks a new era of opportunity for everyone, from consumers and businesses to cities and governments.
IoE/M2M is changing our world, but its effect on daily life will be most profound. We will move through our days and nights surrounded by connectivity that intelligently responds to what we need and want—what we call the Digital Sixth Sense. Dynamic and intuitive, this experience will feel like a natural extension of our own abilities. We will be able to discover, accomplish and enjoy more. We are creating the fabric of IoE/M2M for everyone everywhere to enable this Digital Sixth Sense.
How will the IoE/M2M happen? Key elements that make it real are already here. Powerful smartphones are a natural tool to deliver IoE experiences. And wireless networks, a fundamental layer of IoE/M2M connectivity, are integrated around the globe. Those elements are ready for everyone to leverage, and we are making that easier than ever.
As a leader, we have an unmatched portfolio of visionary solutions that deliver the connectivity and communication needed to support the IoE/M2M opportunity industry-wide. As a partner, we enable and amplifiy other companies’ IoE/M2M product and service innovations. Together, we are bringing IoE/M2M forward faster, making the Digital Sixth Sense a natural extension of how we work and play.
Macrolake Cloud and CPS based assets autonomous maintenance
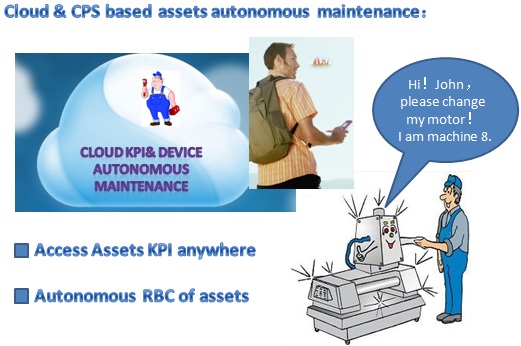
We have experienced team to support you in cloud and cyber phisical system (CPS) based asset management area. Using the system,
1, You can access the asset situation including KPIs anywhere only if you have one empowered mobile terminal (MT);
2, Once the spare part almost reaches it life cycle, the machine can remind the technician of maintaining it;
3, It uses RFID to monitor the Spare parts usage and its inventory level to avoid repeated book of SPs and keep a safe storage level;
4, It summarizes and calculates the specific life of SPs to avoid down time of machine;
5, Once the machine is broken sown, it helps the technician to find the root cause of problem quickly;
6, Everything will be quick and on time if you depend on cloud and cyber physical system...
English
Smart Energy and Security
 The same advanced communications and computing platforms powering billions of portable devices is now available to enable utilities to reliably, securely and cost-effectively deploy smarter grids and reach smarter homes. At the heart of all this, is embedded chipset technology from Qualcomm that provides:
Cellular connectivity – Ubiquitous consumer coverage*, high bandwidth and real-time communications of 3G and LTE cellular networks enable critical smart grid functionality such as advanced smart metering, demand response, distribution automation, quick over-the-air firmware updates and outage management.
Home area connectivity – When used in and around the Home Area Network, HomePlug GreenPHY and low energy Wi-Fi provide unsurpassed whole home coverage, performance and reliability in an energy efficient manner.
- Established technology footprint, scale and maturity (3B+ WiFi & 100M HomePlug endpoints)
- Wi-Fi and HomePlug are based on the same IEEE networking model, which allows for seamless connectivity without translation.
- Combining the flexibility of Wi-Fi and ubiquity of powerline provides unsurpassed coverage throughout the Home Area Network. When used in the Home Area Network the combination of Wi-Fi and HomePlug Green PHY provide an unsurpassed whole home coverage.
- High bandwidth (Mbps), IP-based connectivity enables state-of-the-art security protocols and quick software updates against cyber-threats.
English
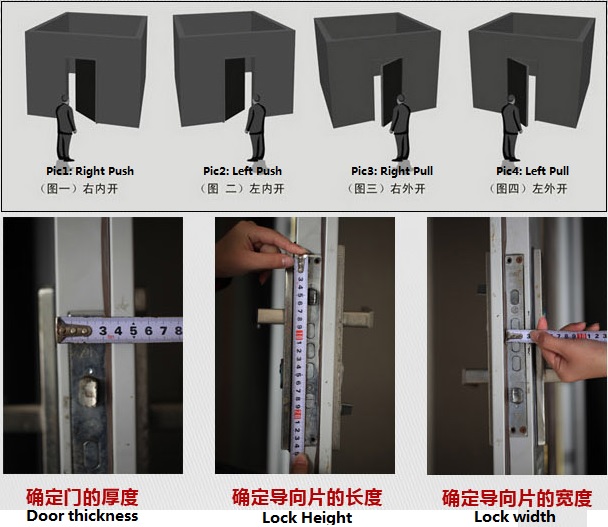
Smart phone Bluetooth based door lock

Smart phone Bluetooth based door lock make it possible that you need not to take physical key or card any more. For easy use of the older and children, we keep the physical key.
Free app download and setup:
Android app:http://www.appchina.com/app/com.scaf.android.client/
IOS version app store address:(Log on apple's APP STORE,search “sciener” and install the app)
Friendly reminding: When automatical unlocking is killed by iphone, you need to switch off bluetooth and open it again to open the door.(Manual mode is recommended.)
Benefit:Need not to take physical key;Need not to change lock when changing renting person; One click no pass word unlock; Remote delete or freeze user; Not based on internet; Ontime mornitoring door situation; 4 type5 batteries can work for 10 years; Configurable recognition distance; Low lock power alarm to phone; Automatical locking after 5 seconds; Recognition time within 2-5 seconds based on your android version.
Must tell us the following parameters when you decide to buy:
English
$271.84
Product category:
图像:

Stock:
328
Use your phone to feed pet remotely
SmartFeeder allows you to care for your pet from anywhere using smart phone with customized alerts and notifications. You need not to worry about feeding your pets when travelling or working outside home. Through portion control and nutrition management, SmartFeeder will combat the pet obesity epidemic.SmartFeeder will save you $350* per year from portion control - not to mention avoided medical costs.

English
Services & projects
We serve remote, classroom and on-site traning and projects coaching your people to improve the process, optimize the plant and reduce the waste. And the following is the services' prices baseline which may be adjusted according to specific accommodation, transporation and enviroment. The payment supports multiple currencies. You can use points or currency to buy remote services in points store directly.
|
HACCP QA Training |
5days*8hrs/day |
|
|
In plant 4000$; In Macrolake 400$/Person |
|
DMAIC plant optimization training |
2days*8hrs/day |
|
|
In plant 2000$; In Macrolake 200$/Person |
|
HACCP Project |
20-60days*8hrs/day |
|
|
On-site coaching (40 000-120 000$) |
|
DMAIC 6 sigma plant optimization project |
50-80days*8hrs/day |
|
|
On-site coaching(100 000-200 000$ ) |
|
TPM/WCM plant operation improvement project |
50-80days*8hrs/day |
|
On-site coaching(100 000-200 000$ ) |
|
| Personnel skills improvement project |
50-80days*8hrs/day |
|
|
On-site coaching(100 000-200 000$ ) |
![]()
English
Cloud and CPS based assets autonomous maintenance
We have experienced team to support you in cloud and cyber phisical system (CPS) based asset management area. Using the system,
1, You can access the asset situation including KPIs anywhere only if you have one empowered mobile terminal (MT);
2, Once the spare part almost reaches it life cycle, the machine can remind the technician of maintaining it;
3, It uses RFID to monitor the Spare parts usage and its inventory level to avoid repeated book of SPs and keep a safe storage level;
4, It summarizes and calculates the specific life of SPs to avoid down time of machine;
5, Once the machine is broken sown, it helps the technician to find the root cause of problem quickly;
6, Everything will be quick and on time if you depend on cloud and cyber physical system...
English
Mobile phone based universal appliance remote controller
Throw away all kinds of remote controllers at home, only one smart phone can control all of the appliances including TV, DVD, air conditioner etc.

English
$159.84
Product category:
图像:

Stock:
99
TPM related cost saving cases sharing

Confirm programe scope: select filling area to optimize its operational cost for this Chinese customer.

Then build up activity based operational cost structure map to identify improvement opportunity. For this American plant, redundant laber was found to be optimized and the effeciency of filling machine needs to be improved using one methodology to calculate the equivalent point of input and output.
Third, setup KPI system and design losses attacking route to improve the availability, performance and quality.
 C
C
Finally to confirm the improvement and cost saving. Over filling of the products was reduced in this plant in which there are 10 lines with OEE being 57% (World class OEE is 85%) and the annualized plant saving is 2.99 million RMB.
English
Asset criticality and the priority of MRO
Prioritize the maintenance of assets.
 Asset criticality=SUM(Failure probabilityXFailure result or severityXFailure weight)
For example:
Asset criticality=Failure resulted RBC probability(0-1)XFailure resulted RBC cost(0-10)*20%+Failure resulted production loss cost probability(0-1)XFailure resulted production cost(0-10)*30%+Failure resulted Hygiene & Safety probability(0-1)XFailure resulted HS loss cost(0-10)*20%+Failure resulted Enviromental loss probability(0-1)XEnviromental effect(0-10)*20%+Failure resulted Law broken probability(0-1)XEffect(0-10)*10%。
The criticality of asset decides the criticality of MRO which decides the criticality of spare parts. But also the criticality of MRO is decided by the lead time and annual consumption of spare parts etc.
Risk or probability appraisal formular::P*S*η/D。P stands for failure probability which value is 0-1;S stands for severity with the value is 0-10,η stands for correcting factor,to assure the value of S is 0-10。D is the detective level。
P value,record as 1 if happend veery day;then the probability will be 0.1 if frequency is once per 10 day. If frequency is 1/100, the the value will be 0.01. Generally, CIL is carried out every 500 running hrs,TBM is based on 1000 running hrs.
English
Competitive KPIs of Asset optimization relative to ISO 55001 certificate
To improve the competitiveness of the end product of one enterprise, the asset optimization is a chanllengeable but effective improvement opportunity which is one heavy component of the operational cost. For physical asset, the monetary value of human resources often takes 25-50 percentage of operational cost (The percentages of labor cost in US and Europe are usually higher than Asia and Africa though the gap is disappearing in recent years. ), asset consumption is usually about 30%, and the energy consumption is usually about 25-30%. So the goal of asset optimization is usually to reduce the labor usage, fixed asset consumption and the energy consumption which can reduce operational cost dramatically. For an excellent enterprise, the operational cost often takes 5% of system cost with the poor one being around 15%. To maximize the asset value, the other perspective is to focus on the OEE which will be 70 t0 85% with an exellently run enterprise. Based on these, some people who involved in the draft of ISO 55000 recomendded to increase the weight of operational cost percentage and OEE to 20% respectively without an agreement. Any way the 9 competitive KPIs use the same weight reached the agreement until the April of Year 2014. By the global climate warming, advocating for less enegy consumption is an eternal topic especially for those who want to be an responsible ones and have an good reputation to be an social and ecological contributors consistently.
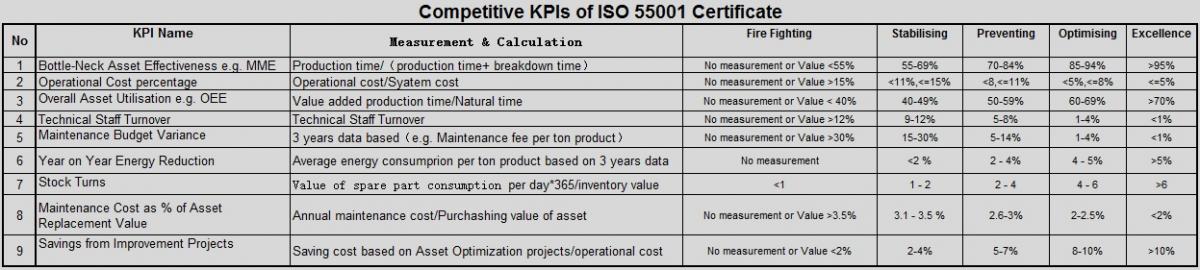
To accomplish the targets of 9 KPIs, 40 KBIs are recommended to indicate the practice levels. Supportive best practices are advocated by PAS 55 which experienced a lot of perfection and was converted to ISO 55000. 17 modules are raised in PAS 55 which evolved to 7 ones in ISO. Though 17 modules were not mentioned in ISO 55000 series any more, the best practices are generally accepted in manufacturing and service industry. Based on the same reason, the competitive 9 KPIs and 40 KBIs relative to PAS 55 are also adopted popularly in the world who would like to use ISO 55000 to guide their asset management and optimization.
English
Asset provision and how to trigger it
The level of asset provision is the average OEE of capacity pool in one specific duration such as one year. One month after the asset provsion, the average OEE of capacity pool can be calculated.
Asset provision level is one core KPI of enterprise's competitiveness because the percentage of assets' cost including depreciation, maintenance, energy consumption and labor usage etc. in the operational cost is more than 60%. The best provision level in the world is between 65% and 75%.
Asset provision includes asset purchase, asset relocation, asset scrap and asset sales etc.
Capacity pool is the combined capacity of series of platforms which can produce same categories of SKUs. When calculating provision level, the OEE of capacity pool should be combined as weighted average of different platforms such as equipment producing bread and lines fermenting beer. When triggering one specific provision action, the OEE of capacity pool must be calculated by same separated platforms. Bread lines cannot be calculated together with beer ones. Besides, when having new provision, capacity pool must include all of the same platforms in the whole enterprise. When having asset relocation, the same platforms of the capacity pool can be only in one area or specific asset combination.
Asset purchase must consider all of the same platforms in the whole enterprise. Asset relocation only consider the same platforms of one specific combination such as the same platforms in one or several plants which belongs to one specific enterprise.
Triggering of provision is based on the market change or production change if the improvement of OEE has no space any more in current management level of one production unit. If there is improvement of OEE, never consider provision. Based on the production data of capacity pool in the history, the market trend can be observed. If there is one flat trend line, there is no necessaty of asset provision. If the trend line decrease, separate the idle assets from the financial register should be triggered. Only if the trend line increase, the asset purchase can be triggered step by step to avoid cliff provision which may result asset wall or redudance.
English
Decision making criteria of asset management
Six decision making criteria are popularly used in asset management :
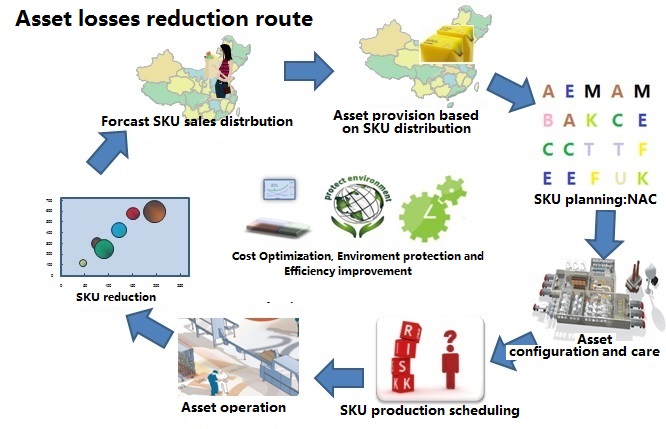
1, Identical density distribution model of SKU sales forcast in paticular area is used for capacity planning of bottle neck machines and configuration of production line which is dicided by specific SKUs combination guiding the production schedule in the future;
2, OEE provision model is used to calculate the capacity requirement of bottle neck machines based on sales forcast;
3, Production line configuration model is used to configure the specific machines combination based on SKUs production planning with high OEE and less redundant assets;
4, Poisson simulation model for binomial distribution of inventory or stock level is used to look for the equivalence point of LOC (Level of cost) and LOS (Level of service) of materials, spare parts or end products;
5,NPV (Net present value) based LCC (Life cycle cost) model is used to do economical provision or handling of assets;
6, Maintenance eqivalence point model is used to decide enough but without redundant activites relavant to maintenance based on RCM (Reliability centered maintenance) principle to assure enough efficiency and less invesment.
English
How Technology Can Fix America’s Crumbling Infrastructure


English
Michael Robinson Chavez—The Washington Post/Getty ImagesA man waiting aboard a train at the Metro Center station in Washington on Mar. 30, 2016. Metro's top officials warned that the transit system is in such need of repair that they might shut down entire rail lines for as long as six months for maintenance.
Before it's too late
Our country is literally falling apart.
When you drive over a bridge, do you think twice? When you hop on the subway to work, does it faze you? If it doesn’t now, it will. Soon, that infrastructure that we depend on will be in ruins. You may think this is dramatic, but I am afraid it’s not. According to the American Society of Civil Engineers, it will cost our country more than $3.3 trillion over the next 10 years just to maintain our infrastructure as it is now, not to mention any attempts to bring it into the 21st century. This is an urgent issue.
The entire Washington, D.C., subway system is on the brink of ashutdown; railway organizations struggle to understand recent crashes; and bridges across the country are in desperate need of repair, according to an alarming report earlier this year from the American Road and Transportation Builders Association. Putting aside the complete chaos that any major failure in our infrastructure would cause to the economy, it’s just flat out unsafe. As citizens of the world’s largest economy, we should expect a safe, modern transportation experience in our country.
In addition to the safety risk, the inefficiencies caused by inadequate infrastructure are estimated to cost every family in the U.S. an average of$3,400 annually. This is due to the myriad ways poor infrastructure affects business productivity and transportation costs that, in turn, cause prices to rise for goods and services.
It is time for the nation to stop putting our collective heads in the sand and invest in a plan to organize, manage and monitor road repairs, bridges, signs, signal systems, repair facilities, inspection programs, required documentation and thousands of other critical details.
Where do we start?
We have to become vigilant of continually changing guidelines and regulations. For example, we should adhere to ISO-55000, an international compliance standard that advises on how to best manage physical assets, which can range from things like subway cars to wheel safety sensors, or even structural properties such as bridges and tunnels. We should also look to the Moving Ahead for Progress in the 21st Century Act, a bill, passed by Congress in 2012, that acts as a funding agent for governmental infrastructure and stipulates the necessary level of compliance with “State of Good Repair” guidelines. Regulations such as these are designed to shift the collective mindset away from using tax dollars to chasing down reactive repairs, and rather set us on course to proactively invest in a smarter, more durable infrastructure.
The most efficient way to satisfy all of these requirements, secure funding and ensure a process that proactively detects needed repairs and safely prolongs the life of equipment is by investing in asset management and the technologies that provide the needed visibility and predictive maintenance. Government agencies that are able to administer public infrastructure are finding that new asset-centric software helps them prioritize projects based on risk and criticality, and invest their capital improvement funds in ways that will have the greatest impact. This process requires five steps:
1. Create an inventory of every existing asset.
Every last bolt and screw that functions in our transit system needs to be catalogued and tracked. Technology should be utilized to house all data elements associated with asset infrastructure, including the necessary critical groups of data: unique identification, classification, start of lifecycle date, estimated useful life and replacement cost estimate. Other important information includes condition assessment history and whether the asset is already part of a funded replacement/rehab project.
2. Identify viable projects.
An asset’s condition, based on inspection, age, criticality, and risk, will determine its priority for repair or replacement. TERM Lite is an analysis tool that helps transit agencies assess their repair backlog and determine the investment needed to achieve compliance. The TERM rating scale assigns rankings from one (poor) to five (new) to assess both the probability of failure as well as the consequence of failure, with assets approaching zero as they reach the end of their scheduled useful life.
3. Define prioritization criteria.
An agency needs to determine what would be impacted by a service failure: critical issues such as safety and reliability, or quality issues such as comfort, efficiency, and enjoyment? The American Public Transportation Association employs something called the Capital Asset Inventory and Condition Assessment, which classifies each asset into one of five groups based on its ratio of age to useful life. An asset with 100% of its useful life consumed is assigned a rating of 1, while an asset with 76% to 100% of its useful life consumed is rated a two, and so on. By cataloging and tracking each asset with an assigned value, technicians are able to locate, repair or replace an asset before it fails.
4. Prioritize projects based on their ratings.
Some technologies provide a capital planning request feature that allows you to define and view your compliance backlog, sorted by priority and category, to determine where it makes the most sense to focus.
5. Model investment effects.
By relying heavily on age assessment of assets, the need for funding may be overstated. Instead, modern maintenance practices such as condition-based or performance-based replacement may be appropriate. In a transit scenario, for example, transformers will be replaced based on age regardless of condition due to their extreme criticality, whereas railcars may be able to have their lives extended based on modified maintenance practices.
The American infrastructure is vital to our collective success, and it is time for our government to undertake the same procedural changes that most private sector industries began implementing years ago. The key to revitalizing the American infrastructure is through strategic investments in technologies that create sustainable efficiencies, the same kind that are inherent to modern asset management. Our current system may be failing us, but it is not yet too late.
How to Calculate Fair Value
Fair value is the value of a transaction between two parties that reflects open and willing negotiations. It can be challenging to calculate fair value if there are no clearly observable market prices. In general, fair value calculations fall into one of three categories. The first involves using market prices that are quoted on a transparent and liquid exchange of some kind, like a stock market. The second category uses comparable prices for assets that are very similar to the asset under valuation. This often applies to homes and cars. The last group is theoretical, and uses the discounted cash flow method to determine fair value.
Instructions
-
Calculate Fair Value With Comparable Information
-
1
-
2
Determine the fair value of a house for sale on a given block by researching the sales prices of similar houses in the neighborhood. For example, if three homes recently sold for specific prices, and these homes are very similar to the home being evaluated, then use the average of the three sales prices.
-
3
Add the sale prices of the three similar homes and divide by three. For example: 225,000 + 250,000 + 245,000 = 720,000; 720,000 / 3 = 240,000. The estimate of the fair value of the home in question is $240,000.
Calculate Fair Value With Cash Flows
-
1
Use the discounted cash flow method for an investment that creates a series of cash flows for which there is nothing comparable or similar.
-
2
Write down the cash flows of the investment. For example, a $100,000 investment that produces $25,000 annual cash flows for five years will be written down as: (100,000); 25,000; 25,000; 25,000; 25,000 and 25,000.
-
3
Write down 1+ an assumed rate of return that is expected for this investment next to each 25,000 payment. For example, if the assumed rate of return is 5%, then write down 1.05 next to each 25,000.
-
4
Raise each 1.05 to the power of each year of that cash flow using a calculator. For example: 1.05^1 = 1.05, 1.05^2 = 1.10, 1.05^3 = 1.16, 1.05^4 = 1.22 and 1.05^5 = 1.28.
-
5
Divide each 25,000 cash flow by the corresponding discount factor for each year. This produces five discounted cash flows of: 23,810; 22,676; 21,596; 20,568 and 19,588. Add these five numbers to -100,000, which was the original investment. The result is 8,237, which means that using a 5% rate of interest, the fair value of this specific investment is $8,237.
-
1
Read more : http://www.ehow.com/how_7567235_calculate-fair-value.html By Tom McNulty, eHow Contributor
English
How to deploy asset provision, care and operation
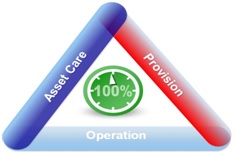
The 3 core components of Asset Management is asset provision, maintenance or care and operation. And ISO55000 certificate is one global accepted award that says that the enterprise have one excellent device management system and operation level.
Deployment of Provision: Devices purchased, people for the devices, applicable materials and products, operational, inspection and maintenance method, facilities, working area and measurement need to be considered to the policy of enterprise and market needs. OEE is one useful internationally accepted criteria to indicate the time to purchase device and confgure the relevant production factors. TCU, the abbrevition of total capacity utinization, is another criteria which is higher than OEE because it does not remove the effect of quality. Any way, for low acid product, 65-75% is the purchase reminding and for high acid product, the criteria can be improved to be 75% or even 85% for some very excellently operated plants.
Deployment of Asset care: Main inputs are spare parts consumption and the service value (Time multiplying unit salary) of maintenance people with the main output being MME and MTBF which can be increased by missing operate input. Advanced preventive maintenance can detect and forcast the CIL time of spare parts or machine to avoid redundant maintenance and malfunction relevant corrective maintenance waste at the same time to assure a very high ratio of output devided by input. But a lot of industry data displays that MME and MTBF positively correlate to production amount which says that the more you use the machine, the better it performances. But to keep the miachine in a very good performance really needs the consumption of spare parts especially when the maintenance is based on TBM (Time or production amount based maintenance) but not CBM (Condition based maintenence).
Deployment of Asset operation: Can we achieve the target of low cost and high performance and yield? In this part we need to optimize the operational cost and measure its reduction without production amount affecting. We can only compare the differences of operational costs based on the same production amounts. Yield can be measured by production amounts directly, though sometimes it is not accurate because it is very difficult to measure the input material in dairy industry without the support of quality flow meter. The common used meter is level guage of tank liquid which has about 200-300 kg variation per ton. The operation level of one plant or device is generally monitored by TCU(OEE). Preformance index of device is often using PTU (Production time utilization) which is often lowered by missing operate input and interuppted machine stops such as having lunch etc.
English
Autonomous Maintenance
Requires 100000 POINTS in the General category.
English
Autonomous Maintenance Pillar
Requires 100000 POINTS in the General category.
English
AM step change criteria
English
Success criteria from 1st step to 2nd step
The gap between put x removed tags should be below 20%
All operator should be trained on the 1st step and must have ability on level 3 or above.
The difference between the operator that issue more tags and the one that issue less tags, should not be more than 50% (involvement)
Dirt source and hard access places listed
Measure total time for cleaning
Elaborate at least 1 OPL/month per each operator (average)
Level of cleaning on the machine should be according to cleaning standard
Tags related to SAFETY, 100% solved or planned to be solved (not delayed)
Abnormality identification (tags) more than 90% ( it means that if the steering committee finds 10 point that should have a tag during the final audit, and the operator had identified just 99 tags, 10/99 is more than 10%, thus this team cannot change the step)
English
Success criteria from 2nd step to 3th step
The gap between put x removed tags should be below 10%
All operator should be trained on the 2nd step and must have ability on level 3 or above.
The difference between the operator that issue more tags and the one that issue less tags, should not be more than 50% (involvement)
Dirt source and hard access places analyzed (5 whys) and 85% of them already solved and registered by OPL (before – after)
Cleaning time reduced on 50% comparing to real time spent on final phase of step 1.
Elaborate at least 1 OPL/month per each operator (average)
Level of cleaning on the machine should be according to cleaning standard
Tags related to SAFETY, 100% solved or planned to be solved (not delayed)
Abnormality identification (tags) more than 90% ( it means that if the steering committee finds 10 point that should have a tag during the final audit, and the operator had identified just 99 tags, 10/99 is more than 10%, thus this team can not change the step)
English
Success criteria from 3th step to 4th step
English
Requires 60 POINTS in the General category. Success criteria from 4th step to 5th step
English
Requires 60 POINTS in the General category. Success criteria from 5th step to 6th step
The gap between put x removed tags should be below 5%
Age of tags no more than 30 days
Tags removed by the operators more than 60% of the total tags of the step
The difference between the operator that issue more tags and the one that issue less tags, should not be more than 30% (involvement)
All operator should be trained on the 5th step and all the subjects related to this step and must have ability on level 3 or above.
There is a cabinet with tools for small repair and adjustments, it is clean & organized and there is no missing tools.
100% of the inspection points are covered with visual identification/work range.
More than 80% of the Q points been inspected by the operator.
Cleaning, Inspection and Lubrication activities/status according to the standards and schedule.
Tags related to SAFETY, 100% solved or planned to be solved (not delayed)
Abnormality identification (tags) more than 95%
Level of defect - 30% lower than the previous step.
English
Success criteria from 6th step to 7th step
Requires 60 POINTS in the General category.
English
Autonomous Maintenance Step 6
Requires 100000 POINTS in the General category.
English
Autonomous Maintenance step1
1.1Autonomous Management Planning;
1.2Initial cleaning and tagging preparation and planning;
1.3Initial cleaning activities;
1.4De-tagging activities and promotion of continuous tagging;
1.5Introduction of first temporary standard.
English
Autonomous maintenance step7

AM Master Pillar Machine Objectives –
Infinite loop concept implemented for:
Breakdowns,
Short stops,
Speed loss,
Set up,
Defect,
Process Waste,
Accidents.
The operator will be responsible to manage all aspects related to his equipment such as Safety, Quality, Maintenance, Efficiency or even Equipment Upgrades that require capital investment.
Man Objectives:
Develop Skills:
Operational,
Maintenance,
Analytical
Breakthrough skill
Multi skill operators
machine swap-ability
Step 7 Sub-Steps
Implement the circle team
Team Skills inventory
Create the job descriptions
Ensure cross training process
AM Man - Machine
Infinite Loop implementation
English
Focused improvement deployment
Requires 100000 POINTS in the General category.
English
Individual, Focused or Productive improvement audit
Requires 60000 POINTS in the General category.
English
Planned maintenance
Requires 100000 POINTS in the General category.
English
PM Step1: Assess the machine and understand the current situation
Requires 100000 POINTS in the General category.
English
PM Step2: Restore deteriorated conditions and improve weak points
Requires 100000 POINTS in the General category.
English
PM Step3: Use breakdown analysis to identify breakdown's root cause
Requires 100000 POINTS in the General category.
English
PM Step4: Build a periodic maintenance system
English
Forums:
Step4: Build a periodic maintenance system
Repetitive breakdown-PM analysis.
Sporadic or new breakdown-Reliability centred maintenance (RCM) including X matrix and FMEA etc.
PM Step5: Build a predictive maintenance system
English
Forums:
Step5: Build a predictive maintenance system
Use 5 sensory to predict malfunction.
PM Step6: Assess planned maintenance system
English
Forums:
Step6: Assess planned maintenance system
>Maintenance cost: Direct maintenance cost, production loss by failure and financial management cost.
>4 M root cause analysis. Plant performance improvement.
Planned maintenance-overview
English
Forums:
Planned maintenance Pillar:
>Increase plant performance;
>Reduce maintenance costs by up to 30%;
by:
>eliminating unplanned stoppages;
>developing a cost effective planned maintenance system through
- the involvement of line crew operators;
- enhancement of competencies and the implementation of systems in professional maintenance organization.
All this can be achieved with a four phases program, organised into 6 steps, implemented in three years.
Plant perfomance includes: OEE, breakdown,storage cost of spare parts,energy consumption,total maintenance cost.
PM eliminates unplanned stoppages, and most breakdowns are caused by simple reason that a good maintenance system can remove and handle.

PM requires the involvement of line crew operators to keep the equipment in control.

PM enhances competencies and implemens system in the maintenance organization.

Example of PM vision:
Study and implement an ideal maintenance policy by systematic improvement and cost effective maintenance activities of machine conditions.

Planned Maintenance: Vision/Mission example:

Pillar mission versus plant mission:
Pillar mission: To guarantee our internal customers' satisfaction
Strategy: To integrate maintenance team with operators through Autonomous Maintenance.
Link with Plant vision:Productivity and reliability.

Target of Planned maintenance pillar
English
Forums:
Mission of PM (Planned maintenance)
To guarantee our internal customers satisfaction, Improving the Maintenance indicators through breakdowns and costs reduction.
Pillar indicators and result

General Yearly plan (For Year 2008)
Expand RCM to A、B machine to improve TBM (Time based maintenance) system;
Explore more CBM (condition based maintenance) activities (with Thermo-Graphic inspection and vibration monitoring);
Reduce maintenance cost; (from 100% of Y2005 to 95%);
Continue to support AM.
Focus on staff training (review maintenance skill matrix, arrange training plan).
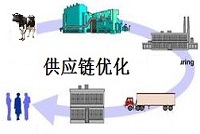
Supply chain Optimization
Requires 100000 POINTS in the General category.
English
1.1Plant Logistic Process's huge impact on cost
Requires 100000 POINTS in the General category.
English
1.2Losses and KPI introduction
Requires 100000 POINTS in the General category.
English
1.2.1Key performance indicators in Logistics
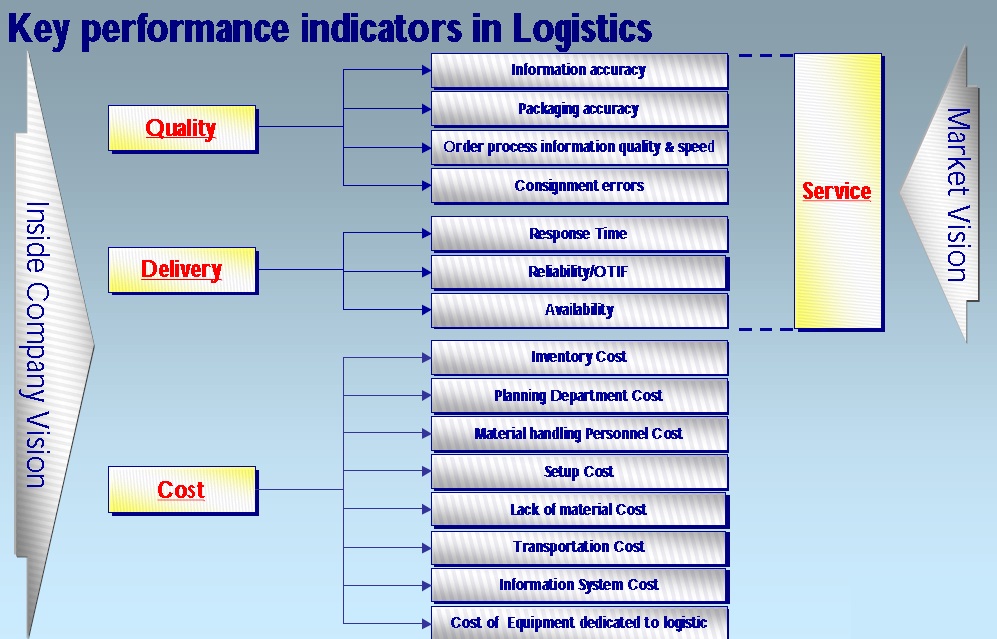
The cost, quality and delivery of logistics should be considered in this chapter.
English
1.2.2Total logistic cost and examples
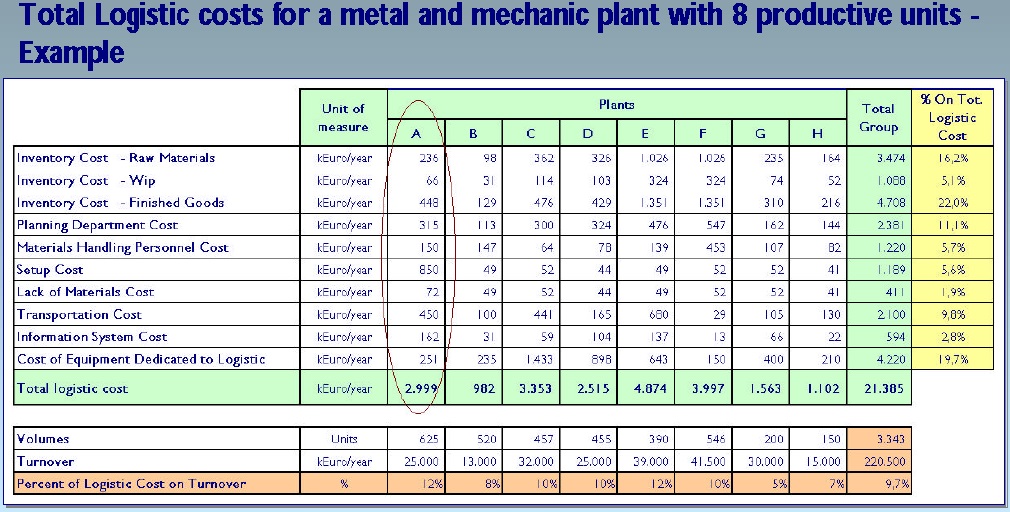
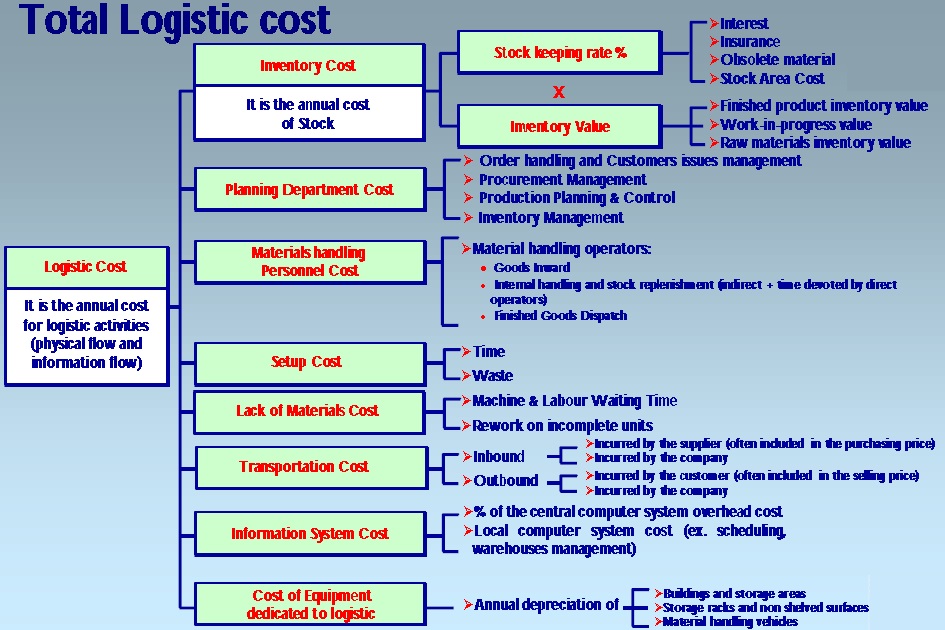
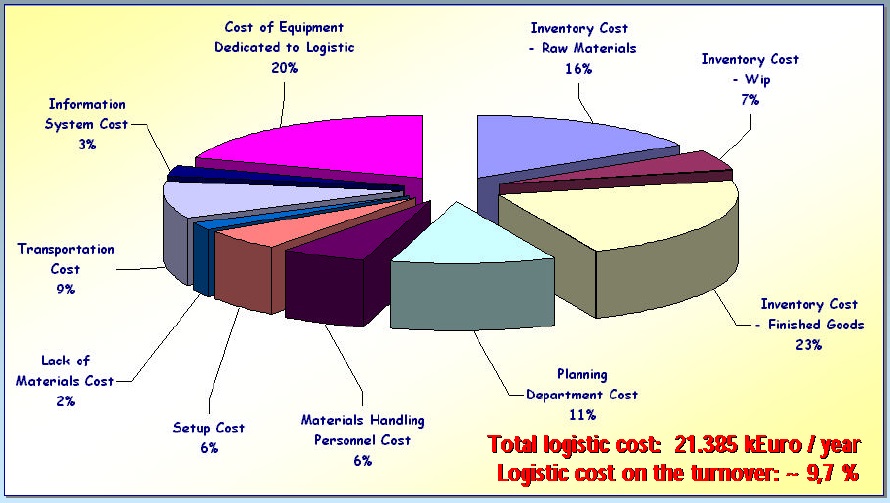
Such as inventory level cost, preparation or setup cost, personnel cost, facilitation cost, forcast cost and transportation cost etc.
English
1.2.3Service level
Service level Definition
It’s a measure of Customer Satisfaction. It is the compliance to customer requirements or needs along the different service dimensions. Each process of the Supply Chain has a service level to be assured to the downstream processes in order to ensure the same service dimensions to be guaranteed by the entire company to the final customer.
Each process has its own Service Level requirements.
Customer Relationship.
1. Answer the phone within 2 rings.
2. Speak in a calm and courteous tone of voice.
3. Present yourself, clearly indicating the name of the company.
4. Take notes in a special notepad during the phone call.
5. Try to calm the caller's anger.
6. Listen to what is being said as though you personally care.
7. Don't interrupt the caller while he/she is speaking.
8. When the caller has finished speaking,briefly sum up the reason for his/her call and request confirmation.
Business positioning is to be coherent with customer's needs and competitive advantage on key competitors.
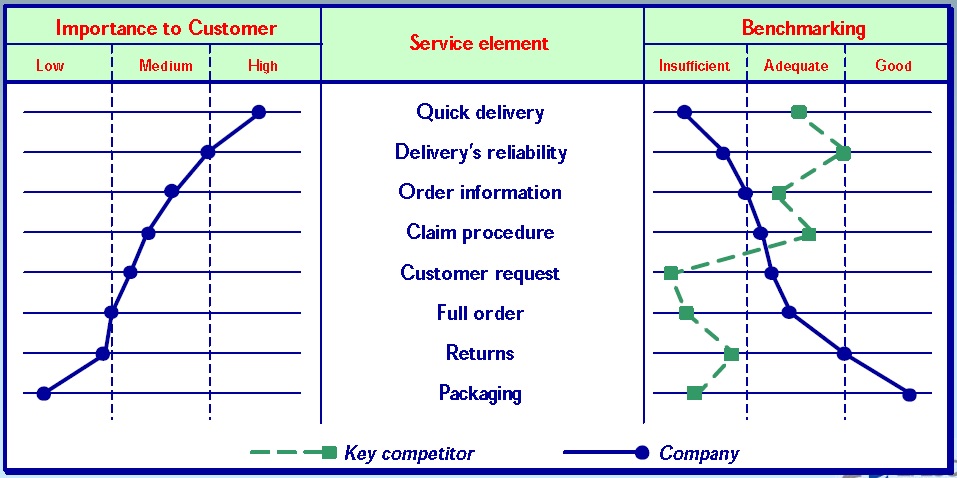 We can identify 3 main dimensions allowing Service Level evaluation:
Response time
Reliability/OTIF (On Time In Full)
Availability
English
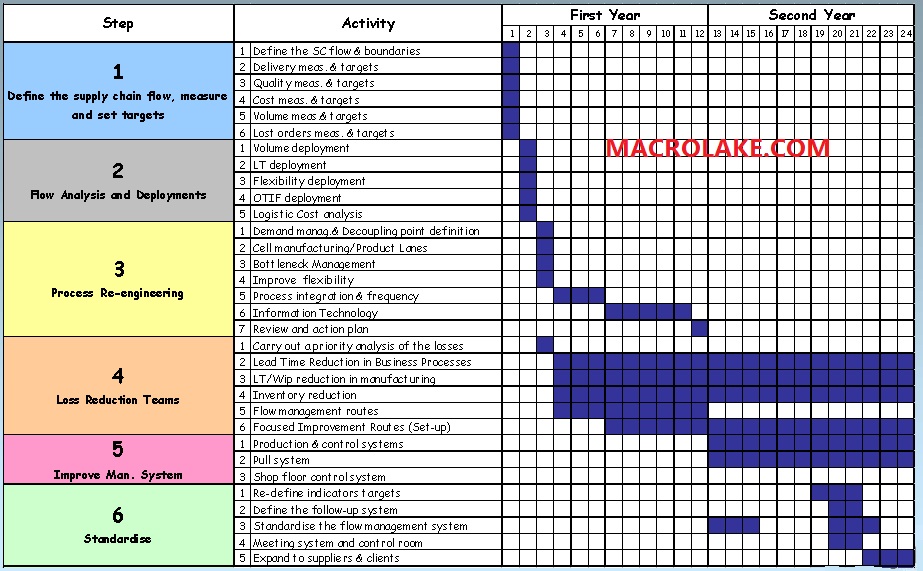
1.3General route of lead time reduction
Requires 100000 POINTS in the General category.
English
1.4Two year plan of lead time reduction
English
2.1Planning and MPS(Major production schedule)
Planning definition
It is a "contract" between Sales and Production
It covers a short/medium-term period ( 1 - 6 months) with weekly itemization
Deciding
what to produce
which batches
sequences to adopt so as to allow production launch and material management(production capacity utilization)
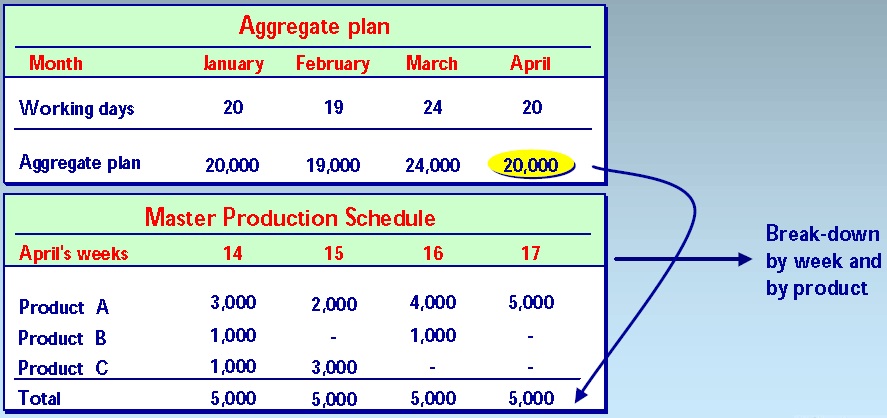
It breaks the aggregate plan down into specific items with a higher level of detail on products and schedules
It acts as a buffer between Sales and Production
It steers the whole production and material management system
It drives purchasing and capacity checks
It provides information on customer order processing
Relationship between aggregate plan and Master Production Schedule
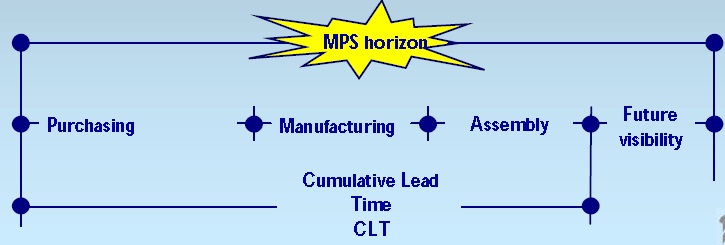
Planning horizon
The Master Production Schedule is developed for a period of time called" planning horizon".
The "planning horizon" should at least be as long as the longest cumulated lead time (CLT) plus a period of future "visibility".
Cumulated lead time is the longest period of time required to carry out product-making activities and it can be determined from the product's "timing" structure (bill of materials) by looking for the longest throughput time for each production step.
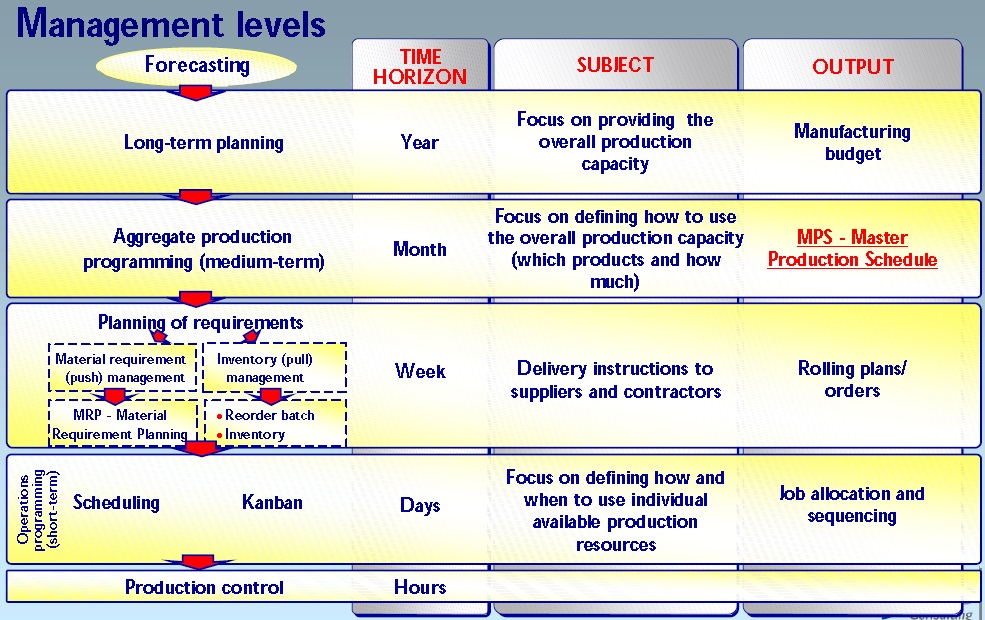
Planning hierarchy
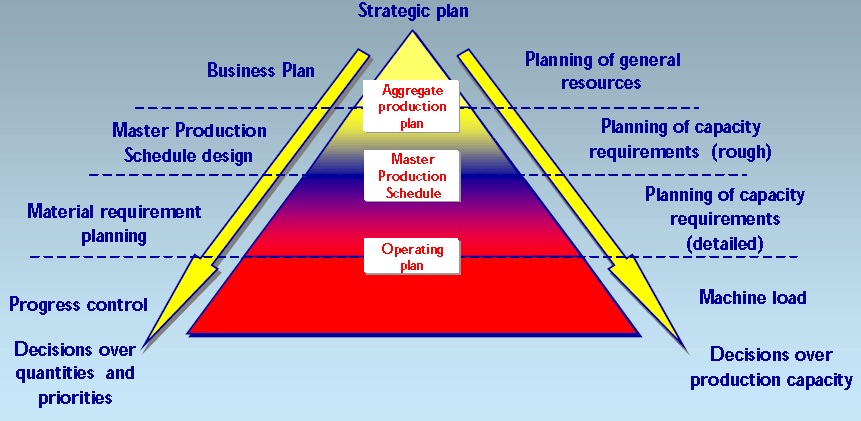
Planning management levels
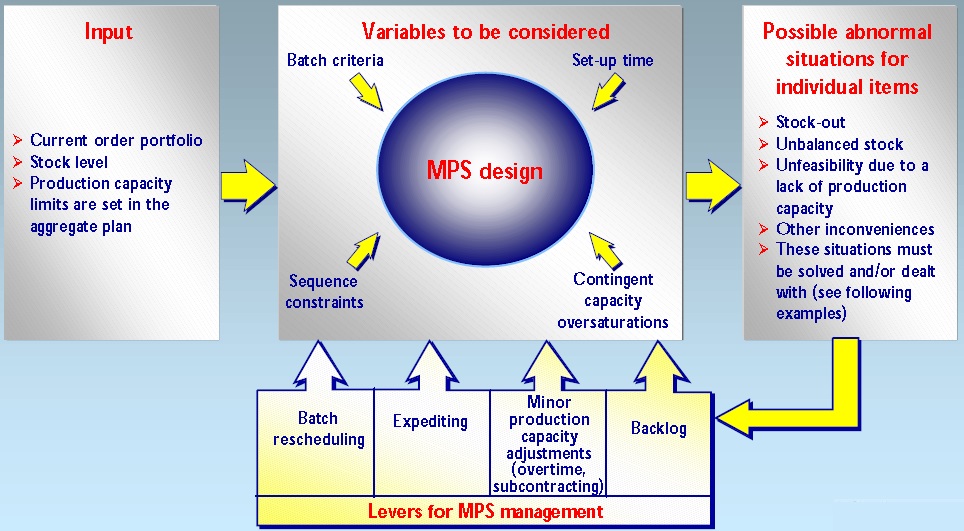
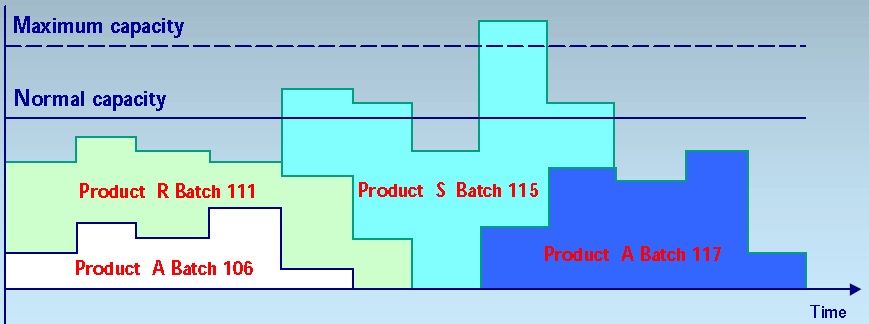
Master prodution schedule design-Variables to be considered
English
2.2MRP(material requirement plan)
Requires 100000 POINTS in the General category.
English
2.3CRP & Scheduling(Capacity requirement plan workload per workshop)
Requires 100000 POINTS in the General category.
English
3.1Bottleneck Mgt
Requires 100000 POINTS in the General category.
English
3.2Inventories Reduction
Requires 100000 POINTS in the General category.
English
3.2.1 Step1 Inventory Reduction-understand current situation
Requires 100000 POINTS in the General category.
English
3.2.2 Step2 Inventory Reduction-Restore to basic condition for good inventory
Requires 100000 POINTS in the General category.
English
3.2.2.1 Safety stock
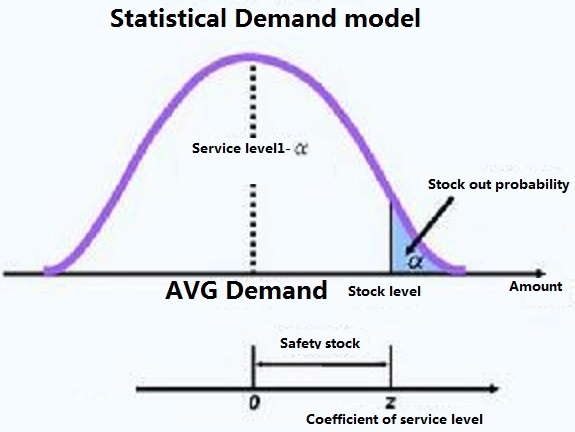 Safety Stock
First of all, here's the formula so you don't have to dig through my well-written article for it.
Safety Stock: {Z*SQRT(Avg. Lead Time*Standard Deviation of Demand^2 + Avg. Demand^2*Standard Deviation of Lead Time^2}
If that wasn't clear to you, I suggest reading on. This article will explain in detail what safety is used for, and how to use it.
Inventory management is about two things: not running out, and not having too much. Our desire to not run out, along with uncertainties in demand and supplier lead times are why we have inventory in the first place. Essentially, inventory is a reserve system to prevent a stock out. However, as important as it is to prevent such a stock out, we also don’t want to hold onto too much inventory because of holding costs. So how do you balance the two and what is the right amount? More importantly, when should you re-order in order to prevent a stock out? The answer to this can be determined by obtaining and applying the following information about the inventory you wish to manage.
Re-order Point (ROP)
1. What is the average lead time for the part/finished good that you need?
2. What is the standard deviation of that lead time? It is very important to track how long shipments take from you suppliers. If you are not doing this, start. It should be your top priority. Assuming you have tracked the data, excel can very easily help you determine your standard deviation. In excel, go to the toolbar and click on Insert, then click on Function, and choose STDEV and click ok. Then, enter in as much lead time data you have and presto, you have your standard deviation.
3. What is the expected demand you are working with?
4. What is the standard deviation on this demand? Perhaps this is something you will be familiar with from experience, however, if not, this is something you should be able to squeeze out of Ted from the marketing department. One way to find it is to look at historical demand and use the STDEV function in excel to determine it.
5. How sure do you want to be that you aren’t going to run out? 90%, 95%, 98%, 99%? Whatever you decide, this will become your service level. Using this percentage, a statistical z-table should be used to get the corresponding “z-value.” A good z-value webpage can be found at http://www.inventoryops.com/safety_stock.htm. So, for example, if you want a 98% service level, you would use 2.05 as your z-value.
Ok, so you’ve gathered this data, now here’s what you do with it.
(Underlined section is safety stock)
Re-order point=Average Lead Time*Average Demand + Z*SQRT(Avg. Lead Time*Standard Deviation of Demand^2 + Avg. Demand^2*Standard Deviation of Lead Time^2)
In this formula, the first term (Average Lead Time*Average Demand) is the average demand.
The second term {Z*SQRT(Avg. Lead Time*Standard Deviation of Demand^2 + Avg. Demand^2*Standard Deviation of Lead Time^2} is the term that allows for the safety stock. In other words, the second term is the optimal safety stock level.
It is not simple to gather all the data that is needed for the calculations. For a product with multiple parts, each part needs to have its own re-order point calculations and its own safety stock calculation. This can all become very confusing if proper computer modeling is not employed.
Although I mentioned excel earlier, excel is probably not sufficient for your company’s software needs. If you have not already done so, it is very important to look into an integrated software package for these calculations and many others.
English
3.2.3 Step3 Inventory Reduction-Introduce a system to record the anomalies
Requires 100000 POINTS in the General category.
English
3.2.4 Step4 Inventory Reduction-Stabilise the process and solve the anormalies
Requires 100000 POINTS in the General category.
English
Supply chain audit
Requires 6000 POINTS in the General category.
English
ISO 55001 certification guideline and best practices
 This part guides one enterprise how to get the certificate of ISO 55001 to maximize the value of assets including fixed assets using 17 modules advocated by PAS 55 or ISO 55001. It includes 9 KPIs, 40 KBIs and 127 best practices. Generally, to get certification of ISO 55001, score 3 is a must. If the sore is <= 1, the record will be fire fighting, and the score will be recorded as stablising when it is from 1 to <=2, preventing will be recorded with the score being 3, optimisingwill be recorded with the score being 4 and Excellence will be recorded with the score being 5.
English
Asset management Maturity assessment - Bubble graph
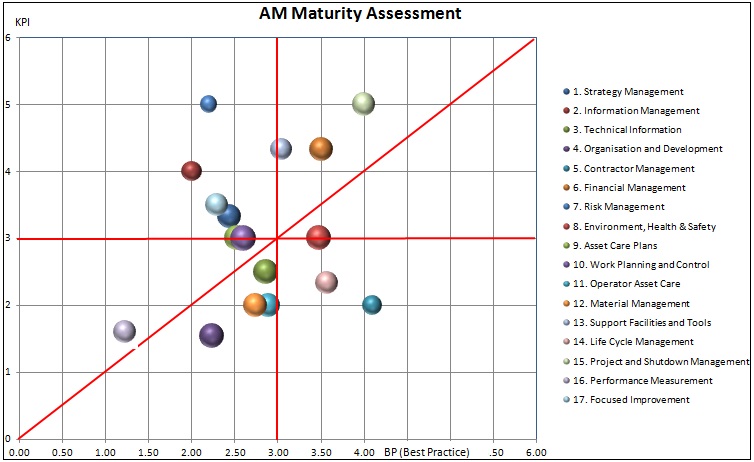
Bubble located at the upper - right coner is one ideal maturity level. Bubble located at the upper - left coner is one level with none sustainable one. Bubble located at the lower - left coner is one level with poor result without proper measures. Bubble located at the lower - right coner is one level with practices which seems good without suppoting good KPIs. Bigger bubbles stand for better correlationship between KPIs and BPs.
English
How to link KPI, KBI and BP to score the maturity
| 1. Strategy Management | |
| Best Practices | |
| Best Practice | Score |
| AM Steering Committee | 2 |
| AM Policy | 2 |
| AM Strategy | 1 |
| AM Improvement Targets | 2 |
| AM Master Plan | 2 |
| Strategy Communi-cation | 1 |
| Progress Management | 2 |
| AM Maturity Assessment | 1 |
| KPIs | |
| KPIs | Score |
| Asset Effectiveness (eg OEE) | 3 |
| Operational Cost per Unit | 2 |
| Overall Asset Utilisation | 2 |
| 2. Information Management | |
| Best Practices | |
| Best Practice | Score |
| Information Requirements | 2 |
| Information Systems | 2 |
| Data Quality and Accuracy | 2 |
| Data Velocity | 2 |
| Data Mining Capability | 1 |
| Reporting | 2 |
| KPIs | |
| KPIs | Score |
| Maintenance Data Velocity | 3 |
| Financial Data Velocity | 3 |
| Material Data Velocity | 1 |
| Asset Data Velocity | 1 |
| Project Data Velocity | 3 |
| 3. Technical Information | |
| Best Practices | |
| Best Practice | Score |
| Technical Information Standards | 2 |
| Processes and Procedures | 1 |
| Asset Register | 2 |
| Technical Library | 2 |
| Change Control | 1 |
| Knowledge Management | 2 |
| Access to Information | 2 |
| KPIs | |
| KPIs | Score |
| Technical Information Availability | 2 |
| Technical Information Accuracy | 2 |
| 4. Organisation and Development | |
| Best Practices | |
| Best Practice | Score |
| AM Organisational Structure | 2 |
| Roles and Responsibilities | 2 |
| Recruitment | 2 |
| Induction Training | 2 |
| Competency Development | 2 |
| Performance Management | 2 |
| Reward and Recognition | 1 |
| Career Development | 2 |
| Ownership and Accountability | 2 |
| KPIs | |
| KPIs | Score |
| % Technical Vacancies | 3 |
| Technical Overtime | 3 |
| Technical Staff Turnover | 1 |
| Technical Staff Absenteeism | 4 |
| 5. Contractor Management | |
| Best Practices | |
| Best Practice | Score |
| Contracting Policy and Procedures | 2 |
| Contractor Selection | 2 |
| Contractual Agreement | 2 |
| Work Management | 2 |
| Performance and Quality Management | 2 |
| Contract Admin. | 2 |
| Contractor EHS Management | 2 |
| KPIs | |
| KPIs | Score |
| Contractor SLA Scores | 2 |
| Contractor Cost Variance | 3 |
| Contractor Lost Time Incident Frequency Rate | 3 |
| 6. Financial Management | |
| Best Practices | |
| Best Practice | Score |
| Financial Management Policy | 3 |
| Asset Valuation and Depreciation | 3 |
| Capex Budgeting | 3 |
| Capex Control | 3 |
| Operational Expense Budgeting | 3 |
| Operational Expense Control | 3 |
| Financial Information System | 2 |
| KPIs | |
| KPIs | Score |
| Capital Budget Attainment | 3 |
| Maintenance Budget Variance | 3 |
| IFRS Compliance | 5 |
| 7. Risk Management | |
| Best Practices | |
| Best Practice | Score |
| Risk Policy | 2 |
| Methodologies | 1 |
| Risk Assessments | 1 |
| Mitigation and Control | 2 |
| Legal and Statutory Requirements | 2 |
| Change Control | 1 |
| KPIs | |
| KPIs | Score |
| Insurance Risk Rating | 1 |
| 8. Environment, Health & Safety | |
| Best Practices | |
| Best Practice | Score |
| EHS Programme Management | 2 |
| Inspections and Records | 2 |
| Physical Asset Safeguarding | 2 |
| Emergency Response | 2 |
| Driven Machinery and Vehicles | 1 |
| Incidents and Accidents | 3 |
| Employee Health | 2 |
| Energy Reduction | 2 |
| Environmental Safety | 2 |
| EHS Culture | 2 |
| KPIs | |
| KPIs | Score |
| Safety Compliance | 5 |
| Lost Time Incident Frequency Rate | 4 |
| Environmental Compliance | 1 |
| Year on Year Energy Reduction | 2 |
| 9. Asset Care Plans | |
| Best Practices | |
| Best Practice | Score |
| ACP Development Process | 2 |
| Criticality Analysis | 1 |
| Tactical Task Definition | 1 |
| Tactical Task Implementation | 1 |
| Long Term Work Plan | 2 |
| ACP Optimisation | 1 |
| KPIs | |
| KPIs | Score |
| % Tactical Work | 1 |
| Asset Condition | 3 |
| Engineering Availability | 2 |
| 10. Work Planning and Control | |
| Best Practices | |
| Best Practice | Score |
| Non-Tactical Work Identification | 2 |
| Tactical Work Identification | 2 |
| Work Planning | 2 |
| Work Scheduling | 2 |
| Work Allocation and Control | 2 |
| Quality Control | 2 |
| Feedback on Work | 2 |
| Feedback Review | 2 |
| Rotable Tracking | 1 |
| KPIs | |
| KPIs | Score |
| Maintenance Backlog | 1 |
| Weekly Schedule Attainment | 1 |
| Labour Utilisation | 2 |
| Technical Overtime | 3 |
| 11. Operator Asset Care | |
| Best Practices | |
| Best Practice | Score |
| Operator Asset Care Policy | 1 |
| Correct Operation | 2 |
| 5S and Equipment Cleaning | 1 |
| Maintenance Simplification | 3 |
| Inspections | 2 |
| Adjustments and Minor Repairs | 2 |
| Visual Management | 2 |
| Operator Knowledge and Skills | 2 |
| Engineering Partnership | 2 |
| #N/A | |
| KPIs | |
| KPIs | Score |
| 5S in Operational Areas | 4 |
| Tactical Maintenance Done By Operators | 1 |
| Engineering Availability | 2 |
| % Tactical Work | 1 |
| 12. Material Management | |
| Best Practices | |
| Best Practice | Score |
| Material Management Policy | 2 |
| Material Master | 3 |
| Purchasing | 2 |
| Receiving | 2 |
| Warehouse Facilities | 2 |
| Protection and Care | 2 |
| Inventory Control | 2 |
| Issuing | 3 |
| Rotable Management | 1 |
| Inventory Optimisation | 1 |
| KPIs | |
| KPIs | Score |
| MRO Stock Accuracy | 4 |
| Stores Service Level | 3 |
| Purchasing Service Level | 3 |
| 5S/Safety in Warehouses | 3 |
| Stock Turns (excluding insurance spares) | 2 |
| 13. Support Facilities and Tools | |
| Best Practices | |
| Best Practice | Score |
| Tool Management | 2 |
| Workshop Facilities | 2 |
| Roads, Yards and Buildings | 4 |
| Services | 3 |
| Lubrication Management | 2 |
| Support Vehicles | 2 |
| Condition Monitoring Management | 2 |
| KPIs | |
| KPIs | Score |
| 5S in Workshops and Support Facilities | 4 |
| Support Facilities Condition | 3 |
| Average Services Availability | 4 |
| 14. Life Cycle Management | |
| Best Practices | |
| Best Practice | Score |
| Whole Life Costing | 1 |
| Need Identification | 1 |
| Feasibility and Approval | 2 |
| Specification and Design | 2 |
| Acquisition | 2 |
| Installation and Commissioning | 2 |
| Decommissioning | 2 |
| KPIs | |
| KPIs | Score |
| Maintenance Cost as % of Asset Replacement Value | 4 |
| Vertical Start-Up | 2 |
| Operational Cost per Unit | 2 |
| 15. Project and Shutdown Management | |
| Best Practices | |
| Best Practice | Score |
| Scope Definition | 2 |
| Project Planning | 3 |
| Risk Management | 2 |
| Progress Review | 3 |
| Communication | 3 |
| Project Handover | 2 |
| Post Project Review | 1 |
| KPIs | |
| KPIs | Score |
| Project/Shut Duration Compliance | 1 |
| Project/Shut Task Compliance | 1 |
| Project/Shut Budget Compliance | 1 |
| 16. Performance Measurement | |
| Best Practices | |
| Best Practice | Score |
| AM KPI Definition | 3 |
| KPI Deployment | 2 |
| Performance Targets | 3 |
| Communication | 3 |
| Usage | 2 |
| KPIs | |
| KPIs | Score |
| KPI Performance | 4 |
| KPI Measurement | 4 |
| 17. Focused Improvement | |
| Best Practices | |
| Best Practice | Score |
| Improvement Focus Areas | 2 |
| Daily Management System | 2 |
| Improvement Projects | 2 |
| Use of Data | 2 |
| Root Cause Analysis | 2 |
| Improvement Actions | 2 |
| Results and Benefits | 3 |
| KPIs | |
| KPIs | Score |
| Savings from Improvement Projects | 1 |
| Improvement Project Success | 1 |
English
Link 9 KPIs and 40 KBIs with 127 BPs relevant to ISO 55001
| 17 modules | 9KPIs + 40KBIs |
| Support Facilities and Tools | 5S in Workshops and Support Facilities |
| Support Facilities and Tools | Support Facilities Condition |
| Support Facilities and Tools | Average Services Availability |
| Asset Care Plans | % Tactical Work |
| Asset Care Plans | Asset Condition |
| Asset Care Plans | Engineering Availability |
| Work Planning and Control | Maintenance Backlog |
| Work Planning and Control | Weekly Schedule Attainment |
| Work Planning and Control | Labour Utilisation |
| Work Planning and Control | Technical Overtime |
| Technical Information | Technical Information Availability |
| Technical Information | Technical Information Accuracy |
| Material Management | MRO Stock Accuracy |
| Material Management | Stores Service Level |
| Material Management | Purchasing Service Level |
| Material Management | 5S/Safety in Warehouses |
| Material Management | Stock Turns (excluding insurance spares) |
| Contractor Management | Contractor SLA Scores |
| Contractor Management | Contractor Cost Variance |
| Contractor Management | Contractor Lost Time Incident Frequency Rate |
| Operator Asset Care | 5S in Operational Areas |
| Operator Asset Care | Tactical Maintenance Done By Operators |
| Operator Asset Care | Engineering Availability |
| Operator Asset Care | % Tactical Work |
| Focused Improvement | Savings from Improvement Projects |
| Focused Improvement | Improvement Project Success |
| Performance Measurement | KPI Performance |
| Performance Measurement | KPI Measurement |
| Organisation and Development | % Technical Vacancies |
| Organisation and Development | Technical Overtime |
| Organisation and Development | Technical Staff Turnover |
| Organisation and Development | Technical Staff Absenteeism |
| Project and Shutdown Management | Project/Shut Duration Compliance |
| Project and Shutdown Management | Project/Shut Task Compliance |
| Project and Shutdown Management | Project/Shut Budget Compliance |
| Life Cycle Management | Maintenance Cost as % of Asset Replacement Value |
| Life Cycle Management | Vertical Start-Up |
| Life Cycle Management | Operational Cost per Unit |
| Risk Management | Insurance Risk Rating |
| Information Management | Maintenance Data Velocity |
| Information Management | Financial Data Velocity |
| Information Management | Material Data Velocity |
| Information Management | Asset Data Velocity |
| Information Management | Project Data Velocity |
| Financial Management | Capital Budget Attainment |
| Financial Management | Maintenance Budget Variance |
| Financial Management | IFRS Compliance |
| Environment, Health & Safety | Safety Compliance |
| Environment, Health & Safety | Lost Time Incident Frequency Rate |
| Environment, Health & Safety | Environmental Compliance |
| Environment, Health & Safety | Year on Year Energy Reduction |
| Strategy Management | Asset Effectiveness (eg OEE) |
| Strategy Management | Operational Cost per Unit |
| Strategy Management | Overall Asset Utilisation |
English
Module 01: Strategy Management
| firefighting | stablizing | preventing | optimizing | Excellence | |
| AM Steering Committee | No formal management committee exists to lead asset management activities in the company. |
An engineering or technical management team meets at least once a month to discuss maintenance or asset management related issues: • Asset management is a specific agenda item. • There is limited participation from departments outside Engineering. • The focus is on short to medium term AM activities. |
Formal AM Committees coordinate all AM activities: • A Steering Committee of senior managers meets at least quarterly. • The Steering Committee is responsible for the AM Policy, Strategy and KPIs • An operational Technical Committee meets monthly to manage progress. • Meetings focus on Maintenance and Engineering issues. |
The AM Committees include all AM functions and aspects: • Material management. • Decisions about asset replacement and capital projects. • Compliance with financial, safety and environmental regulations. • Alignment and coordination of AM activities between departments. • Regular monthly and quarterly meetings take place as planned |
AM Committee meetings are proactive: • Meetings are integrated with normal management meeting structures. • All major AM decisions are based on return on capital investment. • Risk management is proactive and asset-related. • The focus is also on the environmental impact of assets. |
| AM Policy | No formal long term vision or policy exists for asset management. |
The long term goals for some AM elements have been defined: • Asset management or maintenance has been defined as a priority area by top management. • Asset management is mentioned in the organisations policy statements. • The goals of the maintenance function are clearly defined. • Most AM goals are informal and not necessarily endorsed. |
A formal AM Policy has been developed and documented: • It is signed by senior management to show their commitment to AM. • It defines the AM scope and specific improvement goals. • It includes all legal requirements. • It defines the vision for key elements of an asset management system. • It supports the organisations overall business strategy. |
The AM Policy covers all elements of Asset Management: • There is a clear line of sight with the organisations business strategy. • It clearly defines the desired vision for each AM element. • It quantifies the benefits of achieving the vision. • It is actively used to guide all asset management activities. |
The AM Policy is reviewed regularly to ensure relevance and alignment with the organisations business strategy: • It covers changes in the organisational structure and responsibilities. • It addresses the organisations policy for environmental issues. • It is based on a risk assessment. • It is fully aligned with PAS 55. |
| AM Strategy | No long term strategic plans for asset management exist, only short term activities. |
Some ad hoc AM strategies and long term plans have been documented: • Long term plans for maintenance are specified. • Engineering Management was involved in a planning workshop. • These long term plans guide some of the short term AM activities. |
A formal AM Strategy has been developed and documented: • It is based on an assessment of the current AM maturity. • It defines the priorities and focus areas for AM improvements. • It defines the activities, time frames and responsibilities to achieve the key elements of the AM Policy. • Considers the life cycle and condition of the critical assets. |
The AM Strategy has been reviewed to include all AM related activities: • It is fully aligned with the AM Policy. • It covers all AM system elements, e.g. capital projects, facilities, material. • It is fully aligned with the organisations strategic plans and risk assessment. • It considers progress made with AM improvements. • It considers the life cycle and condition of all the physical assets. |
The AM Strategy specifies the initiatives required to become leaders in asset management: • It is based on external benchmarks of best proven practice. • It considers the use of technology and advanced AM practices. • It is pro-active and risk-aware. • It is fully compliant with the principles of PAS 55. |
| AM Improvement Targets | The AM Strategy is not linked to what is measured. The success of asset management is judged subjectively on emotional factors such as the amount of breakdown downtime and the time required to respond to emergencies. |
Some AM KPIs are monitored by senior management: • These KPIs are included in the monthly management reports. • Maintenance costs are compared against budgets. • Asset availability or downtime per department/area is measured. • Safety is monitored. |
A comprehensive AM scorecard of high level AM KPIs has been established: • These KPIs measure achievement of the AM Strategy. • They focus mainly on maintenance. • All KPIs have specific improvement targets and timescales. • The AM Steering Committee developed the AM scorecard for their own use. |
The KPIs have been expanded to include all aspects of the AM Strategy: • These KPIs measure all elements of the AM Policy and Strategy. • The improvement targets reflect the AM priorities and business goals. • These KPIs are balanced to address costs, risks and asset performance. • The AM KPIs have been deployed to everyone involved in AM. |
The AM Scorecard has been updated in line with industry benchmarks: • The scorecard is reviewed regularly to reflect the latest AM Strategy. • The KPI targets are in line with industry benchmarks. • Frontline staff participated in the development of the AM Scorecard. |
| AM Master Plan | No structured plans exist to implement an asset management system or improve the performance of assets. |
Some ad hoc plans exist to implement AM improvement activities: • Plans are fragmented or independent. • Plans focus largely on maintenance activities. • Plans have deadlines and responsible persons. |
A formal AM Master Plan has been derived from the AM Strategy: • It addresses the key elements of the AM Strategy. • It has a one year horizon. • Each activity has specific milestones, responsibilities and detailed action steps. • The Master Plan is used to manage the AM improvement programme. |
The updated and expanded AM Master Plan includes all AM improvement activities: • It addresses all elements of the AM Strategy. • It includes a budget and resource requirements for these activities. • It is in sufficient detail and correct format for effective project management |
The AM Master Plan is used to optimise and coordinate all AM activities: • It shows cross-departmental activities and defines their interdependencies. • It shows the resource loading and is used to balance resources. • It prioritises activities based on their impact on risk and performance. |
| Strategy Communi-cation | The AM vision and action plans are not communicated to or understood by the employees and other stakeholders. |
The AM focus areas and improvement plans are discussed informally with people directly involved in AM: • These discussions are informal, ad hoc and mostly top-down. • Understanding of the AM focus areas and plans is limited. • People outside Engineering and Maintenance are not aware of the plans. |
The AM Policy, objectives and plans are discussed with employees: • Engineering and Maintenance staff understand the AM focus areas and improvement plans. • They know how the plans affect them and their role in them. • They understand the selected KPIs and improvement targets. • They have opportunity to ask questions and make comments about the plans. |
The AM Policy, Scorecard and progress with implementation are communicated to all AM stakeholders: • All AM stakeholders are included, e.g. service providers and other functions. • Various mediums are used for communication, e.g. work sessions, notice boards and newsletters. • All AM departments understand the plans and engage in regular 2-way communication about it. |
The AM Communication Sessions have expanded to AM Discussion Forums: • Progress and improvements are discussed during team meetings, with subsequent feedback to management. • Interesting AM topics are discussed regularly to increase AM knowledge. • Successes and achievements are shared during regular internal AM conferences. |
| Progress Management | AM objectives and action plans are not followed up or reviewed. |
Monthly Engineering Management meetings are used to monitor progress: • Progress against the plans is discussed. • Corrective actions are recorded in the minutes. |
The AM Steering/Technical Committees monitor progress of the AM Master Plan: • The Master Plan progress review is a formal agenda item. • The responsible persons formally present progress against the plan. • Obstacles are discussed and resolved using specific action plans. |
The progress review at the AM Committees is streamlined: • Presentations include progress reviews, contingency plans and success stories. • The effect of actions on the AM KPIs is discussed. • Progress reviews are professional and interactive. • The Master Plan and AM KPI targets are updated if required. |
The progress reviews focus more on analysis and future plans, than reporting past activities: • Reports include risks and countermeasures. • Reports include an analysis of progress, identifying the key success factors. • Focus is on KPI trends and predictions. |
| AM Maturity Assessment | No formal external AM maturity assessment has been done during the past 3 years. |
A formal AM Maturity Assessment has been done by AM experts during the past 3 years: • The assessment used a template of best practices for key AM elements. • The report with results and recommendations is available. • Some recommendations to improve the AM system have been implemented. |
A formal AM Maturity Assessment was done during the past year: • The assessment was done by external or corporate AM consultants/experts. • All the elements of an AM system were assessed. • Gaps and recommended improvement actions were identified. • The assessment forms the basis for the AM Strategy and Master Plan. |
AM Maturity Assessments are conducted annually: • The AM SteerCom commissions these assessments. • Most AM staff participates in these assessments. • Feedback is used to update the AM Strategy and Master Plans. • They form part of the Engineering Managements personal objectives. • Everyone involved in AM receives feedback about the assessment. |
The external AM Assessments are supplemented by internal progress reviews and associated assessments: • An internal team conducts regular AM assessments (at least twice a year). • The AM maturity assessment results form part of all AM managers personal objectives and performance contracts. • Other assessments (e.g. ISO, EHS, Insurance Risks) are integrated and aligned with the AM Assessment. |
English
Module 02: Information Management
| Items | Firefighting | Stablising | Preventing | Optimising | Excellence |
| Information Requirements | Asset management information needs and relevant data sets have not been identified. |
Information requirements are based on intuition and what is available: • Reports are generic and standard, with little customisation. • Reports requirements are based on day to day operational activities. • Reports and source data are often duplicated. |
Information requirements are based on a formal needs analysis: • These requirements are linked to the AM Scorecard of selected KPIs. • Input data and sources are defined. • The report format, target audience, frequency, responsibilities and development needs have been defined. • The main focus is on measurement and reporting. |
Information requirements have been refined and optimised: • The information flow is mapped and streamlined to increase data velocity. • Aligned with AM KPIs on all levels (strategic, tactical and operational). • Cross-departmental interfaces in information flow are identified. • The main focus is on analysis and problem solving. |
Information requirements have been projected for the next 2 - 3 years: • AM Strategy determines future information requirements. • All stakeholders are involved in the requirement analysis. • Software and hardware purchases are aligned with the AM Strategy. • The main focus is on real-time information |
| Information Systems | No structured asset management information systems are in place. Information is fragmented and processed manually, limiting its value to individuals. |
Information systems are informal and spread across different platforms: • Some managers use spreadsheets for analysis or control. • The ERP or accounting system is used for financial reporting. • Manual systems are used for work planning and control. • Plans exist to implement an EAMS. |
A formal CMMS or partial EAMS is used, but it is a stand-alone system: • It controls maintenance work. • Maintenance, financial and material management information is available. • Systems are not integrated and some reports are difficult to generate. • Access is limited to a few users. • Users are very dependent on the IT Department for support. |
A full EAMS is used, with partial integration with other systems: • All information needs are satisfied. • A large % of the system functionality is being used, according to needs. • Data duplication is eliminated. • Most people involved in AM have access to the EAMS. • System security and database back-ups are in place. |
The EAMS is streamlined and fully integrated with relevant systems: • Database structures are optimised for single point data entry. • Operational staff can develop their own report queries. • The EAMS is used during daily AM tasks. • SCADA provides asset performance or condition data directly to the EAMS. • Cross-system reporting is possible. |
| Data Quality and Accuracy | Data quality is generally very poor, cannot be measured, and is open to interpretation and debate. |
The accuracy and quality of data vary depending on individuals: • There are pockets of excellence. • Data accuracy is only assessed on request, e.g. during external audits. • Some over inspections are used to check the quality of work feedback and operational data. |
Data quality and accuracy are measured and managed reactively: • Managers do spot checks to emphasise the importance of data quality. • Evidence exists that data quality and accuracy problem areas are addressed. • Data quality is still suspect as the systems are new and skill levels are low. |
A formal process is in place to ensure data accuracy and quality: • Statistical samples of data are used to verify and calculate data quality. • The results are recorded as a KPI and discussed during team meetings. • The engagement of front line workers results in more accurate source data. |
The EAMS ensures data quality and accuracy pro-actively: • Data accuracy is checked at data entry (where possible). • Data capturing is automated (e.g. Barcode scanners) to avoid human error. • Data and information verification tests are built into the EAMS. |
| Data Velocity | Data is not processed electronically. People use manual records for decision making regarding assets. |
Data is processed in stand-alone systems (e.g. spreadsheets): • Data processing requires heavy user involvement with little automation. • Data is only processed when it is required for meetings or at month-end. • Data velocity is slow and information is out of date. |
The CMMS or partial EAMS has improved data velocity: • Some data processing is automated and less dependent on user interaction. • A data processing procedure is in place. • Users have been trained to use the system effectively. • Data is captured and processed at least once a week. |
Information is available from the EAMS directly after data is captured: • Artisans enter Work Order feedback directly into the EAMS. • Material management transactions are captured online. • Data is processed within 24 hours or in line with requirements. |
The EAMS uses technology to provide real-time information: • The EAMS is integrated with asset performance and/or condition monitoring systems to import data automatically. • Technology (e.g. barcode scanners) are used to reduce data capturing time. • Workflow tools are used to automate information flow. |
| Data Mining Capability | Data mining is not possible with the existing information systems. |
Data mining is difficult and time consuming: • Information systems are fragmented with separate databases. • Data is largely used for record keeping and limited reporting. • High computer literacy is required for data mining. • Data is captured with limited detail. |
The CMMS or partial EAMS enables some data mining, but it is not used often: • Data mining is difficult because of the use of different systems. • Only a few experts have the required reporting and analytical skills. • Pareto analysis and different trend graphs are mostly used for analysis. • The focus is on reporting, not analysis. |
The integrated EAMS allows more rigorous data mining: • Drill down reports can access data from different information systems. • Key users are trained to mine data and/or develop user-defined reports. • Database structures are visible for drill down or user-defined reports. • The focus is on root cause analysis and problem solving. |
Data mining is a standard practice in asset management: • Data mining is used to investigate what-if scenarios. • Data mining is partially automated via a parameter selection on reports. • Most EAMS users can use the data mining functionality. • Data mining is being expanded according to user requirements. |
| Reporting | Asset management reports are totally inadequate compared to the stated information requirements. |
Reporting functionality is limited and there is no analytical capability. • A few fixed standard reports exist. • Custom reports can only be generated on request by IT experts. |
A reporting capability exists for trended graphs with limited analysis: • Reports show general trends and events accurately, but they are limited in depth. • The system has standard reports and greater flexibility for generating custom reports. |
An effective reporting capability exists to satisfy all AM information needs: • All staff can use the system for data processing and reporting. • Reports can access data from different systems. • Reports can be customised as needed. |
Web-based dashboards provide real-time information: • Key information is displayed in the workplace. • Reports can be customised by front line users. |
English
Module 03: Technical Information
| Technical Information Standards | Standards for Technical Information do not exist and different people use different formats. There is clear evidence of varying levels of master data completeness. As a result it is difficult to find the correct asset information in the organisation. |
Informal standards exist for Technical Information: • Asset codes and descriptions are defined in a uniform manner. • Asset types are standardised. • Trades, departments and financial cost centres are standard • Drawing standards are in place. |
A Standards Manual has been developed and approved, but compliance is limited: • The essential master data for the CMMS is defined. • The classification of documents in the technical library has been standardised. • A format exists for internal processes and procedures. |
The Standards Manual has been refined and is fully complied with: • The Standards Manual includes all EAMS-related data. • Standards have been defined for the asset knowledge portal. • The Standards Manual is updated when new standards are introduced. |
The Standards Manual incorporates asset management best practices: • Compliance to the Standards Manual is enforced by the EAMS via drop down menus and mandatory fields. • The Standards Manual is accessible and used by all people involved with asset management. |
| Processes and Procedures | Asset-related processes and procedures are not documented. Operating and engineering personnel use their instincts or experience to perform AM activities. The lack of consistency leads to delays, equipment problems, waste and frustration. |
Some processes and procedures have been defined: • Some AM procedures have been documented for control or compliance. • Most AM procedures are filed in managers offices, with some being displayed in the work areas. • The processes and procedures are not very visual or user friendly. |
Critical AM processes and procedures are documented and formalised: • Work Planning & Control processes are defined in flowchart format. • Standard Operating Procedures (SOPs) and equipment settings are displayed in the workplace. • Material Management processes are defined in flowchart format. |
All AM processes and procedures are documented and formalised: • Focused improvement, change control, cost control and project management processes are documented. • Fault-finding and diagnostic procedures are displayed in the workplace. • All processes and procedures are kept up to date. |
AM processes and procedures have been automated: • AM processes have been built into the EAMS workflow. • Equipment procedures and settings are available electronically in work areas. • Frontline employees participate in streamlining processes and procedures. |
| Asset Register | No official record of physical assets exists in an engineering and/or financial asset register. Assets are not consistently labelled or identified, and asset movements are not controlled. |
Most physical assets are recorded in a stand-alone asset register: • Financial and engineering asset registers are independent of each other. • Limited technical and financial attributes are recorded. • Physical assets are marked with unique codes. • The existence of many assets in the asset register has not been verified. |
Most operational physical assets are formally configured in the EAMS: • Engineering and financial asset registers are linked and cross-referenced. • The asset register complies with the agreed standards. • All physical assets are marked according to a defined standard. • The existence of some assets in the asset register has not been verified. |
All operational assets and some key non-operational assets are configured and controlled via the EAMS: • Financial and engineering asset registers are synchronised manually. • Attributes have been expanded according to the defined standard. • Asset verification and condition assessment is done annually. • All asset-related information is linked to the asset register. |
All physical assets are configured in the EAMS: • Non-operational assets (e.g. furniture, vehicles) are included and up-to-date. • Financial and engineering asset registers synchronise automatically. • Technology such as an Asset Register Information System or Radio Frequency Identification track asset movements. • Verification and change control ensure the accuracy of the asset register. |
| Technical Library | No formal mechanism to store or control asset related documents exists. Documents are scattered in offices and cupboards, making it difficult to access or use them. |
Most asset drawings, catalogues and manuals stored in managers offices: • The manuals and drawings are stored neatly in a dedicated area. • Access is limited to certain individuals in the organisation. • Information is generally out of date and incomplete. • The indexing system is not very logical. |
Asset documents are kept in a central technical library or similar facility: • The library has drawings, manuals, catalogues, specifications, standards. • It is secure and neatly organised according to a formal index. • A formal document management system is in place. • It is managed by an nominated person, in addition to his other duties. • The updating of drawings lags the modifications to equipment. |
The technical library is formalised: • A formal system is in place to check-out/check-in asset related documents. • Most documents are available in an understandable language. • The required documentation is supplied with new assets. • Most documents are in a digital format. • The technical library is managed by a dedicated person. • All documents have back-up copies. |
Document control is fully compliant with ISO 9001 standards: • All documents are formal numbered, with revision and distribution controls. • All documents and drawings are stored electronically (if applicable). • An indexing and search facility ensures quick and easy retrieval. • The document management system is fully integrated with the EAMS. |
| Change Control | No change control system exists to update technical information changes. Physical asset modifications are not reflected in drawings, manuals and/or specifications. As a result, a large number of documents are outdated or obsolete. |
An informal change control system exists, but is not very effective: • A procedure to update drawings and master data exists, but is not enforced. • There is no custodian to keep technical information updated; change control is viewed as everyones role. • Some individuals keep their own records of asset modifications. |
A formal change control system exists for technical information: • A formal system are in place and being enforced by management. • A specific person is responsible for change control. • Drawings and manuals are updated to reflect most of the asset modifications. • A formal Master Data Change Request Form is in use. |
The change control system is entrenched and used proactively: • All proposed asset modifications are reviewed first to consider the impact on safety, quality, performance and cost. • All associated documentation updates are identified and followed up. • Full version control and modification history exist for all documents. • Everyone has been trained in the system and compliance is high. |
The change control system is mature and effective: • The system is integrated with other processes to make it a way of life. • Changes are identified via the source system (e.g. financial system, drawing office, EAMS) and follow-up actions are triggered automatically. • There are no discrepancies between asset configuration and documentation. |
| Knowledge Management | A knowledge management system does not exist, resulting in closely guarded pockets of wisdom. Knowledge is seen as a powerful tool and is not shared with others. As a result, people repeatedly make the same mistakes and experience the same problems over and over. |
Knowledge is shared in an informal and ad hoc basis: • Some experienced managers or artisans coach new employees. • Some operating procedures, standard settings, and fault-finding guides exist. • Documents are stored in informal paper and electronic files. • Some engineering or industry periodicals are circulated to managers. |
Knowledge management is formalised, although it is still immature: • Critical technical procedures and standards are identified. • This information is documented in a specific standard format by the experts. • A knowledge portal is in place to store relevant asset-related information. • AM information and relevant articles are circulated to applicable people. |
Knowledge management is mature and effective: • A specific person is responsible for asset-related knowledge management. • Asset-related best practices (such as settings or diagnostics?) exist for critical assets and are available to employees. • The knowledge portal has articles and information, with a clear index. • Solutions to problems are documented for future use. |
Knowledge management is a way of life in the organisation: • Employees regularly develop one point lessons or other procedures. • The knowledge portal has information from external sources, e.g. suppliers, sister companies, internet sites, etc. • Employees partake in user groups or industry networks to share knowledge. • AM is discussed during regular internal workshops or conferences. |
| Access to Information | Existing asset management information is not easily accessible - it is stored in offices, managers drawers and peoples heads. |
Access to AM information has improved, but it is still ad hoc and limited: • Some key people have access to information, e.g. in supervisors offices. • AM information retrieval is inefficient and slow due to poor indexing. • People keep documents outside the designated locations for emergencies, e.g. manuals/drawings at work stations. |
Formal systems ensure accessibility: • The EAMS gives users access the asset register and asset information. • The technical library is used frequently and people find documents fairly easily. • Drawings are kept in a separate cupboard, organised by asset code. • Managers have access to the asset knowledge portal. • A procedure is in place for access to the technical library after hours. |
Technical information is accessible to all employees involved in AM: • Operational employees can access the EAMS via distributed work stations. • The technical library has 24x7 access. • Documents in a digital format can be accessed electronically. • Key employees have access to the asset knowledge portal. • The indexing system makes document retrieval easy. |
Information accessibility is optimised: • Operational employees have access to drawings, specifications and standards via work stations at their work stations. • Most documents are in digital format and can be accessed electronically. • Employees have access to the internet and intranet, including the asset knowledge portal. |
English
Module 04: Organisation and Development
| AM Organisational Structure | Responsibility for asset management is fragmented throughout the organisation, which is functioning in silos. The Maintenance Department is totally divorced from the Operations Department, and other AM functions are often performed by Maintenance as add-on tasks. |
Most of the AM functions exist, but are still isolated: • The Engineering Manager is not part of senior management. • Maintenance is coordinated centrally and operates across all areas with no specialisation or ownership. • Maintenance foremen are in place. • Legal EHS appointments are in place. •A specific Projects Department exists. |
A formal AM structure has been defined and partially implemented: • A member of top management is responsible for AM goals and activities. • Some maintenance is decentralised for ownership, with rotation for training. • The responsibility for AM systems, standards and projects is centralised. • The structure provides for maintenance planning and administration. • Resource requirements are based on historical information. |
The AM organisation is effective and efficient: • Single point of responsibility for all AM. • 1st line maintenance is integrated with Operations and managed by an Engineer. • A central maintenance team provides support and performs complex work. • Planners: Artisans in a 1:20 ratio. • Resource requirements are based on the long term strategy and planning. • Contractors are used for peak loads and non-core or specialist tasks. |
The AM organisation is mature and flexible: • Employees are empowered without unnecessary layers of management. • Cross-functional first line teams focus on improving asset performance. • A cross-functional middle management team optimises AM systems. • People on all levels act as champions for specific AM initiatives. • The structure is reviewed regularly according to the strategy and priorities. |
| Roles and Responsibilities | Asset management roles and responsibilities are unclear, resulting in the allocation of blame and counter-productive arguments. Duplicated responsibilities lead to frustration and under utilisation of peoples skills. |
AM responsibilities have been defined by HR in job descriptions: • Job descriptions exist but do not always reflect the real situation. • Many different job categories exist. • Job demarcations restrict the utilisation of peoples skills. • The role of supervisors and managers is to command and control. |
Roles and responsibilities are reviewed according to the AM Policy and Strategy: • Job descriptions have been reviewed inclusively and accepted by employees. • Supervisors and managers focus on planning and training. • Relaxation of strict trade and job demarcations allows flexibility. • Knowledge and skill requirements of critical AM positions have been defined. |
Roles and responsibilities are designed for the ideal AM organisation: • Responsibilities allocated for all elements of the AM Policy and Strategy. • Interfaces between functions are clear. • The focus is on multi-tasking and teamwork, with some cross-skilling. • Supervisors and managers focus on coaching and leadership. • A detailed competency framework is in place for all AM positions. |
Responsibilities are flexible according to team goals and roles: • People are cross-skilled and able to perform a variety of functions. • Specific roles in the team context are defined according to team objectives. • Flexibility is high and people adapt to new roles. • Future roles and competencies are defined as part of strategic planning. |
| Recruitment | No formal system exists to plan for or recruit AM employees. Turnover is high, many vacancies exist and it is common to find wrong placements, leading to frustration and inefficiency. |
A system is in place to recruit people according to job requirements: • Job descriptions and qualification requirements exist for all AM positions. • HR recruits and appoints people based on the specified criteria. |
Recruitment is in line with the AM Policy and AM Strategy: • Recruitment is driven by the new AM strategy, reviewed job descriptions and associated AM organisational structure. • A basic work load analysis exists. • Line management participates actively in the recruitment process. • Most positions have been filled. |
Recruitment is scientific: • Resource needs are based on a detailed work load analysis. • Recruitment is based on a formal competency requirements analysis. • Scientific psychometric tests and skill evaluation methods are used. • All positions have been filled. |
Recruitment is used to ensure future competitiveness: • Future competency needs have been defined and are reviewed frequently. • Potential employees with the right competencies are identified proactively. • The organisation is viewed as a preferred employer in its industry. |
| Induction Training | New employees do not receive formal induction training beyond the normal 2-hour safety briefing and overview of general policies and procedures. Employees learn how to operate and maintain the equipment through trial and error. |
Induction training is informal and limited in scope and content: • A basic induction programme is used to train new recruits. • It covers the organisations structure, physical layout, policies and procedures. • Specialists provide ad hoc equipment training. • Detailed equipment knowledge is picked up from other employees. |
Formal induction training has been introduced, but is not mature: • The induction programme includes elements of asset management. • The AM Policy, Strategy and Master Plan are explained to new employees. • Key AM procedures are covered. • Key employees get job-specific equipment training when recruited. • Progress is reviewed after 3 months. |
The AM induction programme is mature and effective: • The induction programme is aligned with the AM job requirements. • All applicable AM procedures are explained to new employees. • All AM employees get job-specific equipment training. • New employees have regular reviews and a formal assessment after 3 months. |
Employees participate in the induction programme: • Employees help to develop material for the induction programme. • Experienced employees help to get new employees up to speed. • Employees who are transferred or promoted receive induction training. |
| Competency Development | Little or no formal training is done in the organisation, except to comply with legislation (e.g. general safety awareness). No written training material exists and competency assessments are not done. The result is low skill levels and frequent errors and delays during AM activities. |
Training is informal and unstructured: • Formal external training is coordinated by the HR Department. • Training is opportunistic and reactive, instead of being planned proactively. • Experts present some ad hoc in-house training about equipment. • Management has acknowledged the need to formalise training. |
A formal training and development programme has been introduced: • Training is a priority item in the AM Strategy. • Skills matrices and training plans are in place for key AM employees. • All AM employees have been trained in the core AM procedures. • Applicable training material and external courses are available. |
The formal competency development programme is in place and effective: • Skills matrices and training plans exist for all AM employees. • They are aligned with job descriptions and competency frameworks. • Engineering and Operations staff have good technical and equipment skills. • Some cross-skilling among trades. • A formal competency assessment system is in place for all training. |
Skills development is a way of life: • In-house trainers have been developed. • Team members help to develop training material. • Leadership and interpersonal skills are trained at all levels in the company. • Opportunities exist to acquire ancillary skills, e.g. maths, computer literacy. • Cross-skilling is widespread. • On-the-job and peer assessments are used frequently. |
| Performance Management | There is no formal review of the performance of individuals or teams. The only feedback people get is when things go wrong. |
Performance management is informal and ad hoc: • It is driven by the HR Department • An annual appraisal is done for senior employees to define salary increases • These sessions are viewed negatively by most people • Performance against KPIs are discussed sometimes on an ad hoc basis. |
The formal performance management system is aligned with the AM Strategy: • It is covers the AM objectives and reviewed job descriptions. • Managers understand its importance. • The outcome is a personal development plan for employees. • Employees are more positive about it. • There are regular informal discussions with employees about their performance. |
Performance management is mature: • It includes all AM employees. • It is aligned with the competency framework and deployed KPIs. • The link to personal development and performance improvement is understood. • It is done formally every 6 months for individuals and monthly for teams • It is linked to performance contracts and incentive schemes |
Performance measurement is part of the culture of continuous improvement: • It is done quarterly for individuals and teams. • It covers both performance and behavioural aspects. • Improvement plans are monitored and updated frequently. • It includes peer appraisals and 360° appraisals for managers. |
| Reward and Recognition | No formal system exists to reward or incentivise good performance. Salaries are perceived to be unfair. As a result people are demotivated and underperforming. |
The reward system is generic and not linked to performance: • Salaries are generally perceived to be fair and industry-related. • There is a company-wide bonus system (e.g. a 13th cheque). • Management has agreed to investigate a performance based incentive system. |
The rewards system is linked to achievement of the AM objectives: • An industry survey has confirmed that salaries are competitive. • Salaries are determined by individual performance appraisals. • A simple bonus system is based on achievement of the AM objectives. • There is some recognition for performance improvement activities. |
Rewards are team-based and recognition is widespread. • An incentive scheme is in place, based on team performance against KPIs. • Salaries are performance based. • There is wide recognition of exceptional performance. • Managers at all levels use praise and recognition to motivate employees. |
Personal rewards and recognition are also performance based: • Personal remuneration consists of a basic salary and a performance bonus. • The incentive scheme is transparent and fair. • The organisation uses innovative ways to recognise the exceptional performance of teams and individuals. |
| Career Development | Career development does not exist in the organisation. Most employees are stuck in the same position for years, or leave to better their positions. |
Career development is informal and limited: • Key employees have been earmarked for promotion and development. • When someone is promoted, a possible successor is identified. • The process is short-term and not transparent. |
Career development is recognised as a key success factor: • Managers are aware of the principles and benefits of career development. • The process is driven primarily by HR with input from line management. • Career development is discussed briefly during performance appraisals. • Succession plans exist for key AM positions. |
Career development is formal and pro-active: • Possible career paths in asset management have been defined. • All employees discuss potential career paths with their supervisor/manager. • Career development is driven by line management. • Succession plans exist for most positions in Asset Management. |
Career development forms a crucial part of the long term AM Strategy: • Most employees see a clear future for themselves in the organisation. • Succession planning and career development are reviewed as part of the annual AM Strategy. • Recruitment, training and career development processes are integrated. |
| Ownership and Accountability | An autocratic command and control culture exists in the organisation. Employees are not trusted or given any responsibility for major decisions. There is no accountability, resulting in demotivated and disengaged employees. |
Ad hoc pockets of ownership and accountability exist in the organisation: • Some managers are giving certain employees more responsibility. • Examples exist of employees going beyond the call of duty. • Some examples of effective work teams exist in the workplace. • The organisations culture is still largely focused on control. |
Ownership and accountability are key focus areas for management: • Management understands how empowerment, accountability and performance are linked. • The organisational structure makes provision for greater empowerment. • Some examples exist of progress with employee empowerment. |
Empowerment has lead to greater ownership and accountability: • The AM Policy spells out the end state vision for empowering employees. • Responsibilities allow for decision making at lower organisational levels. • Employees are encouraged to suggest possible ways to improve performance. • Teams have taken ownership of their physical work areas and performance. |
Empowered teams drive the day to day performance improvements: • Ownership and accountability are central themes in the AM Strategy. • Front line teams are playing a leading role in performance improvement. • Surveys show that most employees are very motivated and engaged. • Managers/Supervisors play a coaching and supporting role. |
English
Module 05: Contractor Management
| Contracting Policy and Procedures | No formal contractor policy or procedures exist. Everyone manages contractors differently, or applies the same approach to all contracts. |
A number of contracting procedures exist to ensure compliance and control: • Procedures are primarily driven by financial requirements. • Compliance with health and safety regulations is covered in detail. • There is a general understanding that different contracting types exist. • Contractors are largely managed based on instinct. |
A formal contracting policy ,with supporting procedures, exists: • Contractor categories are defined based on work criticality, costs and risks. • The policy defines criteria for deciding when work should be contracted out. • The policy specifies how different contractors should be managed. • Detailed contracting procedures with steps and responsibilities exist and are accepted by all role players. |
The contracting policy and procedures have been expanded and refined: • The current policy and procedures have been implemented and evaluated. • The performance management process for contractors is defined. • The policy and procedures provide sustainable development guidelines. • The contractor development focus is defined, e.g. develop locals, reduce dependency, or improve performance. |
The policy is reviewed regularly in line with the AM Strategy: • Changes in legislation and/or working conditions are addressed. • Changes in operational conditions or the AM Strategy are addressed. • All contract incidents or problems have been analysed and addressed. • Contractors from all categories are included in the review process. |
| Contractor Selection | There is no guideline or process for selecting a contractor. Everyone uses his own judgement, which is normally based on price or some ulterior motive. |
The policy specifies that contractors are selected based on the lowest price: • A procedure defines the format and number of quotations to be obtained. • Extensive motivation is required to accept a higher quotation. • A list of approved contractors is available for a small amount of generic outsourced work. |
Contractor selection criteria are category specific: • Selection criteria have been defined for each of the 4 contractor categories. • These criteria include price, technical competence and EHS track record. • A formal selection procedure defines the steps and responsibilities involved. • A list of approved contractors exists for all significant outsourced work. |
Contractor selection is based on more advanced criteria: • Previous performance is considered. • EHS compliance is considered. • Additional value-adding services are considered. • Affirmative action and economic empowerment are considered. • The list of approved contractors is kept up-to-date. |
The selection process is dynamic: • The criteria are updated in line with the organisations strategy and circumstances. • The selection process supports the sustainable development policy. • It considers the contractors own continuous improvement programme (e.g. ISO 9001 or 14001). |
| Contractual Agreement | No formal contracting agreements are documented. The contractors quotation is the only form of agreement available. |
A generic contractor agreement template is available for contract work: • The agreement is updated for each new contract, but only contains the agreed price and high level deliverables. • EHS requirements are specified. • Formal acceptance is acknowledged by the contractors signature. |
The format of the contractual agreement and the process have been formalised: • A standard agreement template exists for each contractor category. • The contractual agreement covers all aspects defined in the contracting policy. • Specific deliverables and responsibilities are listed in an SLA. • The payment process enforces compliance with the agreement. • The standard guidelines facilitate fast negotiations between parties. |
Formal agreements are in place according to a standards: • All categories of contracts have signed agreements. • Agreements cover all aspects of contractor management, including payment, EHS, performance and roles. • Forward purchase agreements are in place for regular non-critical contracts. • Formal recognised contract negotiation practices are used to define the deliverables and price. |
The EAMS is used to manage the agreements with contractors: • Contractors are aware of their role in implementing the AM Strategy. • The EAMS can facilitate full contractor management and quality assurance (QA). • Performance targets are benchmarked to ensure that they are realistic. • Contract negotiations focus on developing a win-win agreement for both company and contractor. |
| Work Management | The work performed by contractors is managed in an ad hoc way. Instructions are normally verbal, leading to poor control and misalignment with the internal asset management systems. |
Contract owners manage contractors informally with different levels of success: • Field releases or purchase orders are used for instructions to contractors. • The use of the internal safety procedures (e.g. permits) is enforced. • Safe working procedures are available to contractors but not always used. • Contract owners have not had any training in contractor management. |
Contractors are managed via internal work orders from the CMMS/EAMS: • All contracted work is issued via WOs. • Completed WOs are returned and captured as history in the CMMS/EAMS. • The return and completeness of WOs is a pre-requisite for payment. • Safe working procedures are referenced on the WOs. • Persons responsible for contractors had training in contractor management. |
Contractors are managed via the Work Planning and Control system: • All contract work is formally planned and scheduled. • EHS requirements such as permits and risk assessments are included on the WO. • Contractors participate in weekly scheduling meetings to align with maintenance and operational activities. • No contractor is allowed to work on assets without a formal WO. • KPIs such as schedule compliance and backlog are applied to contractors. |
The EAMS enables real time management of contractors: • Contractors record work progress and feedback on-line (via a PDA or tablet.) • WO status is tracked on-line. • Response times are monitored in real time for critical SLA elements. • Problem areas are automatically escalated to the appropriate authority. • Contractors participate in problem solving and improvement initiatives. |
| Performance and Quality Management | The quality of contract work is not checked via a formal process. This leads to frequent rework, repetitive failures and allocation of blame between the organisation and the contractor. |
Performance management is limited to an informal review of work quality: • Ad hoc checks are performed by supervisors during walk-abouts. • Completed work is checked for sign-off before payment. • Extra quality checks are done when using a contractor for the first time. • Some disputes occur because the scope of work and standards are unclear. |
Performance management is formalised: • A formal procedure with clear roles exists for over-inspections and QA. • More effort is spent to manage critical contractors. • Less critical contracts are frequently not managed closely. • Most contract KPIs are generic and not always objective. • Contract work is reviewed at least once during execution, with a final review after completion. |
The performance management process has been streamlined: • The process is category-specific and focuses on significant contracts. • Specific and objective KPIs are used, with predefined incentives and penalties. • The performance of all contractors is regularly reviewed against their SLAs. • Over-inspection results are managed and recorded via the EAMS. • Results are used for future contractor selection. |
The EAMS facilitates the performance management of significant contracts: • The EAMS is used to measure contract deliverables against the SLA. • WOs make provision for detailed quality assurance steps. • Contractors use the EAMS to view their performance and drive improvements. • Response times for critical SLA items are monitored electronically and problems are escalated automatically. |
| Contract Admin. | Contract administration is done in an informal and ad hoc manner, since it is not recognised as a specialist function. As a result, there are conflicts and confusion, and time is wasted in processing transactions that involve contractors. |
Contract administration is more structured but still informal: • Standard procurement rules apply to contracts and contractors. • Contractors are paid on receipt of formal invoices. • Meetings and interactions with contractors happen on an ad-hoc basis. |
A formal contract administration process is in place: • A detailed procedure exists with clear responsibilities and support documents. • People responsible for contract administration had formal training. • A system exists to store and access contractor records and documents. • Interaction with contractors happens according to clear guidelines. |
Contract administration is a streamlined specialist function: • Forward purchasing agreements are in place for frequent low value contracts to facilitate automated payment. • Payment of penalties and incentives are integrated with these FPAs. • Contract agreements are reviewed at set intervals. • Disputes are managed formally. |
Contract administration effectiveness is measured and automated: • Contract administration staff are measured on contract performance. • Contract close-out reports cover lessons learnt and contractor performance. • Closeout reports are stored and used for future contractor selection. • FPAs are used extensively across all contractor categories. |
| Contractor EHS Management | Contractors are expected to perform the work with minimum effort and expense. The contractor is also entirely responsible for all EHS problems on the contract. As a result, there are frequent EHS incidents on contracts. |
EHS performance on contracts is treated with varying levels of importance: • Contractors have to meet initial EHS pre-qualification requirements. • The focus on EHS frequently decreases during the contract execution. • Standards are frequently lowered when contractors do not meet them. • Contractors have to use their own resources to achieve EHS standards. |
EHS is a key focus area during contract allocation and execution: • Contractor pre-qualification requires proof of a working EHS management system conforming to minimum criteria. • EHS induction programs are developed for each contractor category. • The organisation and contractors run joint EHS initiatives. • EHS conformance is a key element of the performance and quality review. |
The organisation invests in contractor EHS capability to ensure full compliance: • All the standard internal EHS practices apply in full to all contractors. • Contractors are rewarded for reaching the organisations EHS targets. • EHS training is provided to contractors. • Formal EHS risk assessments are done jointly before contract commencement. • Safety checks are implemented prior to all contracted work. |
There is a joint zero tolerance approach to contractor EHS practices: • EHS problems are solved jointly and proactively with contractors. • Both parties expect and accept that work will be postponed until EHS standards are met. • Evidence proves that the contractors EHS performance is world class. |
English
Module 06: Financial Management
Requires 1000 POINTS in the General category.
English
Module 07: Risk Management
Requires 1000 POINTS in the General category.
English
Module 08: Environment, Health & Safety
Requires 1000 POINTS in the General category.
English
Module 09: Asset Care Plans
Requires 1000 POINTS in the General category.
English
Module 10: Work Planning and Control
Requires 1000 POINTS in the General category.
English
Module 11: Operator Asset Care
| Operator Asset Care Policy | There is no formal policy regarding the involvement of operators in asset care. Asset care is seen as purely an Engineering responsibility. |
Operators are responsible for some asset care, although not formally defined: • Management from Engineering and Operations supports the involvement of operators in asset care. • Operators are held accountable to prevent breakdowns. • Operators are informally doing a variety of asset care tasks. |
The role of operators in asset care is defined formally: • The AM Policy and Strategy define the vision, scope and plans for operator care. • Operator asset care is a key factor in reaching the AM KPI targets. • The policy addresses IR issues such as job descriptions and remuneration. • This policy has been accepted by all stakeholders (e.g. the union). |
The policy influences the organisational development of Operations: • Operational team structures and performance targets include asset care. • Operator competencies and training plans include asset care. • Operator grading and remuneration are based on their asset care roles. • Operator performance appraisals includes their asset care activities. |
Operators are critical players in the future AM improvement initiatives: • The organisation allows for Engineering / Operations flexibility and teamwork. • Operators use and interpret instrumentation and automation. • Operators play a critical role in equipment performance and costs. • Operators are involved in new acquisition projects. |
| Correct Operation | Operators abuse and neglect the equipment due to ignorance and lack of skills, resulting in frequent breakdowns and costly repairs. |
Operators operate the equipment correctly but without SOPs: • Operators are held accountable for correct operation of equipment. • Operating procedures are informal and based on tradition and gut feel. • Some equipment is damaged during operation. |
Some operators on key equipment follow Standard Operating Procedures: • The correct way of operating key equipment has been defined based on manufacturers recommendations. • It has been documented as formal SOPs. • The SOPs include equipment settings and process parameters. • Most operators are familiar with the SOPs and follow them closely. |
All operators follow Standard Operating Procedures: • The correct way of operating all equipment has been defined. • It has been documented as SOPs in a standard format. • All SOPs include equipment settings and process parameters. • All operators are familiar with the SOPs and follow them closely. |
Operating procedures are refined to improve equipment performance: • Operators refine their SOPs to reflect best practices and eliminate problems. • Some automation or failure proof mechanisms are used to reduce errors. • SOPs are built into the equipment control systems where possible. |
| 5S and Equipment Cleaning | The work area is cluttered, dirty and unsafe. The equipment is covered in dirt, resulting in failures. There is no sense of pride or ownership among operators. |
The work area and equipment are relatively clean and tidy: • No obvious items are lying around in the work area. • The area is cleaned regularly. • The outside of the equipment is clean, but it is still dirty inside. |
A formal 5S and equipment cleaning process has been implemented: • All unnecessary items have been systematically removed. • The area has been properly cleaned. • The equipment is clean both inside and outside. • Regular cleaning schedules and 5S audits are in place. |
The layout of the work area has been organised with clear demarcations: • A place for everything and everything in its place. • The layout makes provision for material flow and easy access for the operator. • The area and equipment remain clean and tidy as a result of regular audits. |
The operators have taken ownership of their work areas and equipment: • Operators support and sustain the 5S and equipment cleaning standards. • Operators conduct the 5S audits. • Operators recommend ways to improve the 5S and equipment cleanliness based on the 5S audit findings. |
| Maintenance Simplification | The equipment is in a poor condition and covered in dirt due to the many oil leaks, spillages, external sources of dirt and because it is so difficult to clean it. Many components are worn or damaged. |
Some equipment problems have been fixed and sources of dirt removed: • Most quick fixes have been addressed. • Obvious oil leaks and other spillages have been fixed. • On closer inspection, there are still some loose connections, worn items, difficult to access areas and missing parts. |
The condition of all equipment is restored and all sources of dirt removed: • The operators were involved in a clean and tag exercise to restore equipment. • All equipment has been restored to as good as new. • All sources of dirt (oil leaks, spillages, etc.) have been identified and removed. • As a result, cleaning time is reduced. |
Accessibility for operator asset care has been improved: • Examples exist of improvements to make it easier to clean. • Examples exist of improvements to make it easier to inspect, lubricate or service. • As a result, operator asset care time has reduced. |
Operators give input during new capital projects to simplify maintenance: • Operators identify maintenance problem areas to be eliminated. • Operators participate during design reviews. • Operators evaluate maintainability during commissioning of new equipment. |
| Inspections | Operators do not monitor their equipment at all and only report failures after they have happened. |
Some operators detect equipment problems during cleaning or operational quality problems: • Some equipment defects are picked up during cleaning • Excessive noise, vibration or operational defects are highlighted. • There is no formal system - inspections depend on operator initiative. |
Formal operator inspections have been implemented on key equipment: • Some operators are responsible for inspecting their equipment as part of the formal Asset Care Plan. • They mainly use their senses for look, listen and feel tasks. • Engineering does selective over-inspections and more advanced checks. • Inspections are controlled manually. |
Formal operator inspections have been implemented on all equipment: • All operators are responsible to inspect their equipment as part of the AC Plans. • Operators mainly use their senses, with some technology tools to supplement it. • Inspection tasks have been allocated between Engineering and Operations. • Inspections are controlled via EAMS. • Ad hoc WOs are raised for defects. |
Operators use built-in diagnostics and instrumentation for inspection: • They can interpret the instruments to identify abnormal conditions. • They use simple condition monitoring equipment like vibration monitoring. • Operators use built-in diagnostics for fault-finding. • Operators raise follow-up WOs in the EAMS when they notice abnormalities. |
| Adjustments and Minor Repairs | Operators do not have any tools and are not responsible for any technical tasks on the equipment. Artisans or setters do all set-ups, adjustments, repairs or changeovers (if applicable.) |
Operators do some set-ups and adjustments based on acquired skills: • These tasks are informal and ad hoc, and differ widely between operators. • Operator replace operational items (e.g. knives, rubbers, etc.) • Operators have not been formally trained or issued with tools. • Engineering is still responsible for the bulk of the technical tasks. |
Operators are trained and certified to do some adjustments and tightening tasks: • Operators have a set of basic hand tools. • They tighten fasteners that are loose. • They do operational adjustments as required. • They do simple lubrication tasks. • They record their tasks on a standard WO per cost centre. |
Operators are trained and certified to do minor repairs and set-up tasks: • They do minor repairs, e.g. replacing components. • They do set-ups and partial changeovers (if applicable.) • They assist artisans during major repairs (e.g. removing covers.) • They record the work done on their equipment via WOs. |
Operators are trained and certified to do more advanced technical work: • Operators replace sub-assemblies and broken components. • They work with artisans during major maintenance (e.g. shutdowns.) • They do changeovers and set-ups on their own (if applicable.) • They do more advanced lubrication, e.g. greasing and oil top-up. |
| Visual Management | There are no visual controls in the workplace, making it very difficult for operators to detect abnormalities or to know what asset care tasks to do. |
Some informal visual mechanisms exist in the work area: • Standard procedures or settings are displayed at some work stations. • Some equipment has visual markings for specific settings or limits. • Some floors are demarcated, but mostly for safety purposes. • The visual mechanisms are not standardised or done professionally. |
Visual management has been standardised and partially implemented: • Visual management standards have been developed and approved. • Visual SOPs and one point lessons exist at work stations. • Cleaning / inspection schedules are in place, with some visual mechanisms to assist operators (e.g. gauges). • All safety demarcations and warning signs are in place. |
Comprehensive visual management is in place: • 5S floor demarcations and storage labels are in place. • Colour-coded change parts and settings are used (if applicable.) • Lubrication points and equipment are colour coded. • Extensive visual mechanisms are used to assist operators with inspections. |
Visual management is automated: • Alarms warn of abnormal situations. • Flashing lights identify equipment problems. • Failsafe mechanisms are used where possible to eliminate human error. • On-line diagnostics and operating procedures / settings assist operators. • Visual controls are included in new equipment specifications. |
| Operator Knowledge and Skills | Operators do not get any structured training or coaching in the correct operation or maintenance of their equipment. |
Operators have some understanding of their equipment / process, based on informal training and coaching: • Operators have been trained on various aspects of their equipment / process. • Training is informal and unstructured, without assessment. • Specific best practices are passed on informally from operator to operator. |
Operators have received formal training in basic asset care,: • Fundamentals of operator asset care, • 5S principles and practices, • Correct operating procedures, process parameters and equipment settings, • Basic hand tools and use. • A competency framework and training plan exists for operator asset care |
Operators have the technical knowledge and skills to do asset care such as: • More advanced hand tool skills, • Basic maintenance skills, eg tightening, replacement, adjustments, • The difference between normal and abnormal conditions for inspections, • Set-ups and changeovers (if applicable). |
Operators have more advanced skills to work with Engineering staff, such as: • Mechanical concepts such as pneumatics, hydraulics, drives, etc. • The use and interpretation of automation and diagnostic controls, • Lubrication and lubricants, • Basic condition monitoring, eg vibration or ultrasonics. |
| Engineering Partnership | The relationship between Engineering and Operations is poor, with regular blame allocation and arguments. The operators general view is I operate, you fix, while the Engineering staff does not trust operators on the equipment. |
Operations / Engineering Management agree about the need to cooperate: • Management encourages cooperation and opposes conflict or blame. • Pockets of cooperation between the departments exist on operational level. • Cooperation is dependent on individuals and is not widespread. • Overall conflict has reduced |
Engineering staff has been allocated to operational areas as part of work teams: • These teams share some KPIs and improvement targets. • Artisans coach operators in asset care. • Some joint problem solving takes place. • Maintenance and operational plans are aligned. • Operator asset care has been accepted by most people at the operational level. |
There is mutual respect and teamwork between Engineering and Operations: • Roles are formally allocated. • Operators assist artisans during major maintenance work. • Operators act pro-actively to prevent breakdowns and failures. • There is regular joint problem solving to improve asset performance and KPIs. • Conflict is rare. |
There is a strong partnership between Engineering and Operations: • Teams are very flexible in terms of their roles and task allocation. • Operators work alongside artisans during major maintenance work. • Targets and rewards are integrated. • There is joint innovation to improve asset performance and AM KPIs. |
English
Module 12: Material Management
Requires 1000 POINTS in the General category.
English
Module 13: Support Facilities and Tools
| Tool Management | Tools are inadequate for effective work. Existing special and hand tools are not properly controlled or used in a correct and safe manner. Tool are generally in a very poor condition and frequent tool-related injuries occur. |
Special and hand tools are managed informally: • Artisans are accountable for hand tools. • Supervisors are accountable for special tools under their control. • A dedicated storing location is the only form of special tools control. • A tool register is in place to ensure that legal and condition inspections are done. • Procedures exist for the correct use of high risk tools, but adherence is poor. |
Hand and special tools are adequate and managed formally: • Regular toolbox inspections ensure the availability and condition of hand tools. • Special tools are stored and controlled by a manual check-in/check-out system. • A tool register ensures the calibration and maintenance of relevant tools. • Machine tools are in working order, maintained and cleaned after use. • Training is done on safe tool usage. |
All tools are managed effectively and are available at all times: • Maintenance and calibration of tools are managed formally via the EAMS. • The movement of special tools is controlled via the EAMS for full history. • All maintenance staff is trained, regularly assessed and certified in the correct and safe use of all tools • All tools are in a very good condition. |
Maintenance personnel are using predictive tools on a daily basis: • Planning of special tools is a normal part of work planning. • Tools are appropriately classified and grouped in the EAMS (e.g. lifting gear, electronics, scaffolding, etc.) • Work delays due to tools are recorded on WOs and analysed to eliminate them. • Tool-related safety incidents are analysed to prevent a recurrence. |
| Workshop Facilities | Workshop facilities are inadequate to work effectively. No thought has gone into the layout of the workshop and housekeeping is very poor. The workshops are dark and dirty, cluttered and without sufficient work space. |
Workshop facilities are just adequate for general maintenance activities: • The layout of workshops is based on gut-feel and some experience. • Workbenches and storage space are sufficient. • Work areas are clean, but cluttered with work-in-progress and components. • Some safety demarcations are in place. • Washing facilities and services in place. |
The workshop facilities are adequate for all required maintenance activities: • Sufficient lighting is provided. • Staff eating areas, change rooms and ablutions are clean, tidy and sufficient. • The workshop layout, partitions and demarcations assist with efficiency. • Jigs are available where required. • Workshops are organised and cleaned according to predetermined standards. • The workshop has an EAMS terminal. |
The workshop location and layout enable an efficient maintenance service: • It is close to the operational assets. • Internal and external noise levels in the workshop is acceptable. • Lathes are not in a vibrating area. • There is adequate clearance for forklifts and good access for large items. • Lifts, hoists and cranes are provided. • Re-usable waste is recycled. • Regular 5S audits sustain housekeeping. |
Workshops adhere to ergonomic standards: • Employees participate in sustaining 5S inside and outside workshops. • Improvements make it easy to keep the workshop clean and tidy. • Lighting, noise, temperature and work stations adhere to ergonomic standards. • Adequate computer terminals give all staff access to the EAMS. |
| Roads, Yards and Buildings | Roads, yards and buildings are neglected since there is no accountability for their upkeep. Leaking roofs or potholes in roads often cause equipment damage or safety incidents. Certain facilities are insufficient for the operational requirements. |
Roads, yards and buildings are sufficient for the operational environment, but maintenance is informal and ad hoc: • Maintenance is normally reactive after numerous complaints or incidents. • The buildings and yards are clean and tidy in the public areas, but cluttered and dirty where people seldom go. • There are still some areas without clear ownership - no-mans land. |
Road, yards and buildings are in a good condition: • All facilities and areas are appropriately registered in the CMMS or EAMS. • The responsibilities for maintaining the roads, yards and buildings is clear. • The annual maintenance budget includes provision for these facilities. • 5S is in place and the roads, yards and buildings are clean and tidy. |
Roads, yards and buildings are maintained properly: • Standard WPC practices are applied, resulting in full maintenance history. • The impact of poor infrastructure on the organisation is well understood. • SIMM (structural inspection and maintenance management) is in place. • Roads, yards and buildings are in an immaculate condition. |
Roads, yards and buildings are planned and managed pro-actively: • The site layout is reviewed to optimise flow and movement. • The impact of operational changes on these facilities is always considered. • A 5 year plan exists to optimise the layout and usage of these facilities. • New facilities are designed to be as maintenance-free as possible. |
| Services | Service facilities are inadequate to support the operation. No thought has gone into the capacity and layout of the services facilities, resulting in inadequate supply at critical operations. These services are not properly maintained, resulting in frequent failures and disruptions. |
Services facilities are adequate to support normal operations: • The supply and distribution of services developed over time and were not planned and designed scientifically. • Disruptions occur when there is a sudden peak in demand. • Maintenance is done on an ad-hoc basis; normally reactive after numerous complaints or incidents. |
The service facilities are adequate for the operations requirements: • Service supply capacity and distribution were designed for operational needs. • All service facilities are registered in the EAMS asset register. • The responsibility for the maintenance of all service equipment is clearly defined. • Maintenance activities on services are recorded in the EAMS. • 5S is in place in all service facilities. |
The service facilities are properly maintained and in a good condition: • All tactical and non-tactical maintenance is planned and recorded in the EAMS. • The Services Manager is regarded as a key member of the AM team. • The reliability and quality of services are reviewed at Engineering meetings. • Service areas and equipment are in an immaculate condition. |
Services are planned and optimised pro-actively: • A formal review of the site layout has optimised service provision. • The impact of operational changes on these services is always considered. • A 5-year plan exists for future service provision in line with operational needs. • New service facilities are designed to be as maintenance-free as possible. |
| Lubrication Management | Lubrication practices and facilities are not being managed. A large variety of lubricants are used, based on personal preference and historical reasons. Lubricants are not controlled and storage is often unsafe and inappropriate. |
Some lubrication controls are in place. • Lubrication is done largely according to the OEM recommendations. • A list of all lubricants in use is available (with stock codes if applicable). • Lubrication tools such as grease guns or oil cans are available. • A standard exists for the proper and safe storage of lubricants, oil and fuel. • Lubricant storage areas are neat but dirty due to frequent spillages. |
All lubrication practices and facilities are managed formally: • Lubrication activities are controlled by the CMMS or EAMS. • The list of lubricants in use has been formally reviewed and is accurate. • Lubricants are controlled and stored according to legal and industry safety and cleanliness standards. • Dedicated tools exist to decant the correct quantities from large containers. • Most of the maintenance staff have received formal lubrication training. |
Lubrication practices are optimised: • An analysis was done to reduce and standardise the types of lubricants used. • Some simple lubrication tasks have been allocated to operational staff, who have received lubrication training. • Visual controls are in place to identify all lubricants and lubrication points. • An external lubrication audit was done during the past 2 years. • Consumption is tracked per asset. • Lubricant storage areas are immaculate regarding safety and 5S. |
Lubrication is automated and optimised where appropriate: • Self-lubricating systems have been implemented. • Lubricant change intervals have been increased as a result of oil analysis. • There is close cooperation with lubricant suppliers to evaluate new technology and products. • Lubrication practices conform to all environmental requirements. |
| Support Vehicles | Vehicles are not well maintained and are generally in a poor condition. There are no clear responsibilities or budgets for the maintenance of support vehicles. These vehicles often break down, resulting in operational delays or safety incidents. |
Support vehicles are managed and maintained informally: • OEM recommended services are normally done, but not tracked formally. • Vehicles are occasionally cleaned. • Operators take no responsibility for cleaning or maintaining their vehicles. • Operators are trained to drive the vehicles properly to prevent damage. • There are no formal maintenance records for these vehicles. |
Vehicles are sufficient and maintained strictly according to OEM specifications: • All vehicles are registered in the asset register of the CMMS/EAMS. • Asset care plans are implemented and tracked in the CMMS/EAMS. • The vehicles are clean and in a good condition. • Operators do formal pre-start safety and maintenance checks. • Operators clean their own vehicles. |
Support vehicles are sufficient, reliable and appropriate: • All maintenance activities and costs are recorded in the EAMS. • Fuel consumption is monitored and deviations reported. • Significant vehicle components (e.g. tyres) are managed effectively. • Vehicle and driver licensing is managed through the EAMS. • Operators monitor vehicle condition and report defects pro-actively. |
Vehicles are managed pro-actively according to operational needs: • All operational changes and plans consider impact on vehicle needs. • Vehicle usage is monitored to optimise the number of vehicles. • Replacement decisions are based on age, running costs and performance. • All vehicles comply with environmental standards. |
| Condition Monitoring Management | No formal condition monitoring capability exists and no condition monitoring activities are being performed. Nobody is really aware of the application and benefits of condition monitoring. |
No formal CM capability exists, but some ad-hoc CM activities are performed: • CM is limited to look-listen-feel activities by experienced artisans. • Engineering managers know about CM techniques and benefits. • Some ad hoc CM has been done by external contractors/consultants. • There is no coordination of CM activities. |
A formal CM capability has been established to perform basic CM tasks: • The CM programme is driven internally with partial support from contractors. • Some artisans have received formal training to perform CM tasks. • The CM activities are not integrated with asset care plans in the EAMS. • CM tasks are defined per asset type, irrespective of the application and environment (eg all pumps). |
The CM programme covers advanced CM activities in an integrated manner: • CM tasks are integrated with the ACPs and managed according to the standard WPC process in the EAMS. • Contracted services are fully integrated with ACPs. • Internal CM specialists have been developed to maintain critical CM skills. • CM activities are appropriate for the equipment and conditions. |
The CM programme is mature and fully integrated with the EAMS: • All CM techniques are considered for possible inclusion in the ACPs. • CM software is fully integrated with the EAMS to provide condition readings. • Standard follow-up tasks are triggered automatically by out of limit readings. • CM specialists are evaluating new technology for inclusion in ACPs. |
English
Module 14: Life Cycle Management
Requires 1000 POINTS in the General category.
English
Module 15: Project and Shutdown Management
Requires 1000 POINTS in the General category.
English
Module 16: Performance Measurement
| AM KPI Definition | There is no clear link between the AM strategy and what is being measured. The success of asset management is judged subjectively based on emotional factors, such as the amount of breakdown downtime and the time required to respond to emergencies. |
Some high level AM KPIs are monitored by senior management: • They form part of managements monthly information pack. • They focus mainly on maintenance budget compliance. • Asset availability or downtime per department or area is also measured. • Safety is monitored. |
A formal AM Scorecard has been set up from the standard list of AM KPIs: • The Steering Committee selected the AM KPIs to be measured. • These AM KPIs are derived from the AM Policy and Strategy. • Maintenance is still the main focus. • Some AM KPIs are deployed to tactical and operational levels. |
The KPIs have been expanded to address all aspects of asset management: • All elements of the AM Policy and Strategy are measured. • The KPIs cover asset performance, costs, risks and control of AM activities. • A full set of AM KPIs exist on strategic, tactical and operational levels. |
The AM KPIs have been refined and updated: • They explicitly measure return on asset investment e.g. RONA or EVA. • They are grouped into leading and lagging indicators. • They change according to AM priorities and external circumstances. |
| KPI Deployment | Employees at lower levels in the organisation are unaware of the asset management goals or of the performance of assets. They are only involved when blame is allocated or culprits identified for breakdowns and other disasters. |
Asset care personnel have some KPIs to measure their performance: • The KPIs help them to focus on the important aspects of asset care. • They are interested in the results and committed to improvements. • All KPIs are not under their direct control. |
The important AM KPIs have been deployed to teams and individuals: • The KPIs are linked to the AM Strategy. • The KPIs are understandable with specific formulas. • They are under the control of the accountable people. • There are not more than 7 KPIs per person or team. |
The AM KPIs have been expanded to cover all asset management functions: • There is full alignment and line of sight with the AM Strategy. • Everyone understands the applicable KPIs and what influences them. • All teams and individuals can interpret the story behind their KPIs. |
The AM KPI deployment is now inclusive and explicit: • Employees are involved in reviewing their AM KPIs. • The KPIs are more applicable to their situation and easier to understand. • These KPIs guide everyones day to day behaviour. |
| Performance Targets | No or very few formal AM performance measures exist in the organisation and the ones that do exist ,do not have specific improvement targets. Good or bad performance is therefore subjective or emotional decisions. |
Only some of the selected AM KPIs have improvement targets: • These targets are formally documented and shown on the graphs and reports. • They are defined by management with no or little consultation. • They are not based on any analytical process and are often unrealistic. • No specific dates have been agreed for the achievement of these targets. |
The AM KPI targets are formalised: • They are based on an analysis of current performance and strategic goals. • Employees understand the actions and potential obstacles to achieve them. • They are linked to specific action plans. • Specific dates have been agreed for achieving these targets. • Employees have accepted them and are motivated to improve performance. |
The AM KPI targets are now mature: • They are linked to the team and individual performance charters and incentives. • They are based on external benchmarks in similar organisations. • They are reviewed annually in line with performance and the AM Strategy. • Teams have full management support to achieve the targets. |
The process of setting AM KPI targets is at an excellent level: • They are set jointly by management and the teams based on overall targets. • They are reviewed quarterly as part of the continuous improvement drive. • They equal or better international industry standards. |
| Communication | There is no or very little communication of asset management results to the broader organisation. They are either kept at a management level or used to blame or punish employees. |
AM KPIs are communicated in an ad hoc and non-standard way: • Some high level KPIs are included in the monthly management report. • Some lower level KPIs are displayed in different formats on notice boards. • The KPIs appear to be fragmented and do not tell a cohesive story. |
AM KPI display is more formal and structured: • Performance trends against targets are shown graphically for key AM KPIs. • Graphs are updated at least weekly. • The organisations performance is displayed on a central notice board. • Team performance is shown on a team notice board in the workplace. |
KPIs are displayed electronically: • Electronic dashboards are available at key points in the workplace. • Performance trends against targets are shown graphically for all AM KPIs. • Performance gaps are highlighted. • Employees can drill down to data to find the reasons for poor performance. • Graphs originate from the EAMS and are updated on a daily/weekly basis. |
KPI display is in real time where possible: • Interactive dashboards are widely available and visible in the workplace. • The information displays are user-friendly and everyone can use it. • Information is real time and refreshed frequently where applicable. |
| Usage | The available information is not being used in a structured way, except for blame allocation and punishment of the guilty. |
Performance measures are used on an ad hoc basis for control: • Operational statistics are reported and discussed in management meetings. • Information is reported against targets with little analysis or interpretation. • The focus is on compliance or controlling of people. |
Performance measures are used in a structured way for improvements: • All KPIs have specific persons responsible for improvements. • Trends and gaps are discussed during management meetings resulting in specific follow-up actions. • Teams discuss performance gaps during daily team meetings, resulting in actions. |
Performance gaps are analysed with data mining to drive improvements: • At senior management and Steering Committee level for strategic problems. • At tactical or middle management level for systems problems. • At operational level for day to day problems. |
Leading KPIs and trends are used to anticipate and prevent problems: • At senior management and Steering Committee level for strategic problems. • At tactical or middle management level for systems problems. • At operational level for day to day problems. |
English
Module 17: Focused Improvement
| Improvement Focus Areas | Improvement activities are ad hoc and reactive, based on emotions rather than on focused priorities. As a result, improvements are not really noticeable. |
There is general consensus about broad improvement focus areas: • The main focus is on safety, cost savings and breakdown reduction. • There is no system to evaluate conflicting priorities. • Asset-related losses are not quantified. • Operational and Engineering objectives are still defined separately. |
The AM Policy, Strategy and Scorecard are used to define focus areas: • Operations and Engineering have common AM objectives and KPIs. • Asset-related losses are broadly quantified. • Short and medium term improvement focus areas and initiatives are defined. • Agreed focus areas are used to prioritise daily problem solving activities. |
Improvement focus areas have been refined and deployed: • Improvement targets and initiatives are allocated to functional areas. • Critical assets and specific losses have been identified for improvement. • These losses are quantified to assist with prioritisation and ROI decisions. • Specific triggers are used for follow-up problem solving for all review meetings. |
Focus areas are dynamically defined in line with the AM Strategy and current performance measures: • The AM strategy is dynamic to guide focus areas. • Performance measures define current performance gaps. • The organisation is flexible enough to respond to changing priorities. |
| Daily Management System | There is no structured mechanism to review asset performance on a regular basis, leading to knee-jerk reactions and frustration. |
Operations and Maintenance Management have separate meetings: • Problems are discussed at daily departmental management meetings. • These meetings focus on explanation and blame allocation for problems. • Managers report functional performance at monthly meetings. • Front-line staff are not involved in these problem solving meetings. |
Cross-functional review meetings exist on strategic and tactical levels: • Asset problems are discussed at daily planning/review meetings between Operations and Maintenance. • Improvement actions are assigned to specific persons. • AM Technical and Steering Committees discuss strategic problems. |
The full daily management system is in place, including front-line teams: • Cross-functional frontline teams discuss and solve daily operational problems. • Unsolved problems are escalated to daily first line management meetings. • Thresholds are used to trigger further investigation and problem solving. |
The daily management system is efficient and pro-active: • Frontline teams deal with most of the problems. • They escalate solutions with cost or wider impact to management. • Management support frontline teams with quick responses. • The AM Steering Committee provides strategic direction and guidance. |
| Improvement Projects | Cross-functional teams are not used to solve complex problems. Actions are allocated to managers operating in isolation or disempowered individuals, resulting in general failure. |
Some examples of improvement projects with varying success: • People are allocated randomly to these projects. • Success depends on the power and influence of the project leader. • Meetings are on ad hoc basis when people have time or when a crisis exists. • There is no structured mechanism for project feedback. |
Formal project teams exist to drive AM improvement initiatives: • Improvement projects are identified in the AM Strategy. • Responsibility is given to an appropriate leader and cross-functional team. • A specific scope, improvement targets and deadlines exist for each project. • Project leaders report progress during regular AM Committee meetings. |
Improvement projects are triggered by the daily management system: • Major or chronic problems are identified as potential projects. • Project selection criteria are based on the AM Strategy and potential benefits. • The project team is selected according to nature of the problem. • The project team is held accountable for results. |
Innovation projects are allocated to cross-functional teams: • A system exists to identify potential innovation projects (eg automation or use of new technology in asset care.) • Projects selected in line with AM Policy and potential benefits • Cross-functional, multi-level teams are allocated to investigate these options. • They report back to top management. |
| Use of Data | Data is never used during problem solving. Solutions are based on gut-feel and emotions, with little or no factual validation. |
Some use of data during problem solving, mainly to quantify problems: • KPIs are used to identify and quantify performance gaps. • There is limited use of data during analysis. • The main source of information is peoples experience and memory. |
Data from EAMS or CMMS is used to support root cause analysis: • Pareto (80-20) analysis is used to identify main problem areas. • Maintenance history is used during root cause analysis. • The EAMS reports are used to identify trends and to verify solutions. |
Data mining is used extensively during root cause analysis: • Teams use repeated Pareto analysis to isolate the problem areas. • Data mining shows different perspectives of the problem, e.g. total downtime vs. stoppage frequency. • Failure types and stoppage reasons are used to confirm root cause analysis. |
Statistical techniques are used to analyse data and find correlations: • Correlation analysis is used to link input parameters to problems. • Statistical process control and capability studies are used for process optimisation. • Standard deviations are plotted to identify sources of variability. |
| Root Cause Analysis | There is no evidence of root cause analysis being done. Solutions are based on gut feel and are therefore not very effective. |
There are some isolated attempts at root cause analysis, but informal and ad hoc: • Some people use 5 Why as a result of problem solving training in the past • Some evidence of fishbone analysis or brainstorming. • The techniques are not always well understood or correctly applied. |
Structured root cause analysis is used selectively: • Technicians, foremen and project leaders have been trained in RCA. • 5 Why is used effectively on the improvement projects. • Good examples exist of fishbone analysis on improvement projects. • Root causes are sometimes verified before implementing solutions. |
Structured RCA is used widely on projects and daily problem solving: • Almost all artisans and operators are competent in root cause analysis. • 5 Why and fishbone analysis are used effectively on all problem solving and investigations by frontline teams. • Verification is used as part of RCA. • Some examples exist of more advanced PM analysis. |
FMECA is used proactively to anticipate and prevent problems: • FMECA forms the basis of asset care plan development (eg RCM or OMM). • FMECA is used for risk assessment. • PM Analysis is used on complex and chronic problems with multiple causes. • Root cause analysis with verification is a way of life throughout the organisation. |
| Improvement Actions | Short term actions are implemented reactively, with little or no consideration of long term preventive actions. Improvement actions are not followed up to confirm their success. |
Possible long term solutions are discussed by management: • Short term corrective actions are implemented effectively. • Functional management teams discuss possible long term solutions. • The selection of improvement actions are based on ad hoc and informal criteria. • Follow-up is done via meeting minutes, but it is not very effective. |
Improvement actions are linked to root causes with formal follow-up: • Improvement actions are only selected after root causes have been confirmed. • Formal documented criteria are used to select the most appropriate solutions. • Solutions are aligned with the AM Strategy. • The Plan-Do-Check-Act (PDCA) cycle is understood and used. |
Improvement actions are selected based on various criteria: • Improvement actions are evaluated on costs, risks and strategy alignment. • Improvement actions are formally monitored to completion. • Successful solutions are standardised in SOPs, schedules and training. • The PDCA cycle is used widely. |
A detailed cost- benefit analysis is used to justify improvement actions: • Improvement actions are selected based on a full cost-benefit analysis. • Improvement activities are monitored during daily meetings. • Successful solutions are rolled out to similar areas (horizontal replication). • The PDCA cycle is a way of life. |
| Results and Benefits | The success of solutions and improvement activities is not monitored. As a result the same problems often occur again. |
The success of improvement actions is monitored informally: • Improvements are assumed to be successful unless proved otherwise. • Management KPIs reflect the success or failure of improvement actions. • Benefits vary - sometimes they are big, but other times small or negative. |
Benefits of improvement actions are tracked formally: • Improvement project leaders report to management on results achieved. • Performance against target is monitored to confirm sustainability. • There are good performance improvements in the focus areas. |
Benefits are confirmed at appropriate levels based on a wide set of KPIs: • Benefits are monitored by teams at operational, tactical or strategic levels. • The impact of improvements on various KPIs is monitored. • Very good performance improvements are achieved across various KPIs. |
The benefits of improvement actions are monitored for 3 to 6 months: • A scorecard of improvement projects is used to measure cumulative benefits. • Improvement actions are clearly linked to the AM Strategy and Scorecard. • Benefits are fully sustainable and performance exceeds industry norms. |
English
ISO 55002 PDCA cycle
The following figure shows the relationship between the key elements of an asset management system (PDCA cycle), together with the related clauses in ISO 55001.
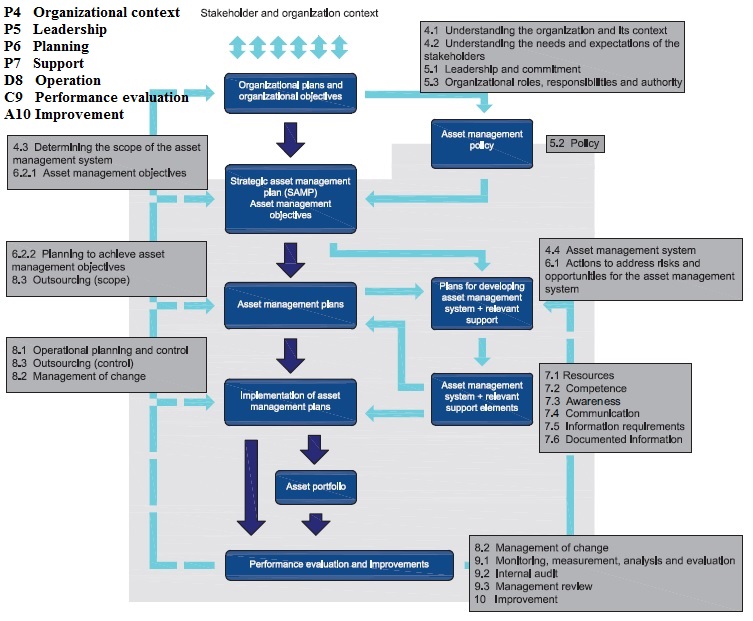
NOTE 1 Only the primary connections are shown to avoid over complexity.
NOTE 2 This does not aim to repeat the distinction between asset management and an asset management
system: it is a connections view showing directions of influence.
NOTE 3 The grey highlighted box designates the boundary of the asset management system.
You can also use the infinite improvement model of macrolake as a reference.
English
METHODS AND APPROACHES TO VALUE APPRAISAL OF MACHINERY AND EUIPMENT

Market Research Approach
This approach involves collection of market data pertaining to assets being appraised. Also known as the "Comparison Sales Approach". The primary goal of the market approach is to determine the desirability of the assets and recent sales or offerings of similar assets currently on the market in order to arrive at an indication of the most probable selling price for the assets being appraised. If comparable sales are not exactly similar to the asset being appraised, adjustments must be made to bring them as closely in line as possible with the subject property.
Cost Approach
This approach is based on the proposition that the informed purchaser would pay no more for a property than the cost of producing a substitute property, assuming the same utility as the subject property. It considers that the maximum value of a property to a knowledgeable buyer would be the amount currently required constructing or purchasing a new asset of equal utility. When subject asset is not new, the current cost must be adjusted for all forms of depreciation as of the effective date of the appraisal.
Income Approach
This approach considers value in relation to the present worth of future benefits derived from ownership and is usually measured through the capitalization of a specific level of income. This approach is the least common approach used in the valuation or appraisal of machinery and equipment since it is difficult to isolate income attributable to such assets.
Depreciation
Defined as the actual loss in value or worth of a property from all causes including those resulting from physical deterioration, functional obsolescence, and economic obsolescence.
Physical Deterioration
Form of depreciation where loss in value is due to factors inherent in the property itself and due to changes in design, or process resulting in inadequacy, over capacity, excess construction, lack of functional utility, or excess operating costs.
Economic Obsolescence
Form of depreciation, or loss in value, caused by unfavorable external conditions. These can include such elements as industry economics, availability of financing, loss of material and labor sources, passage of new legislation, and changes in ordinances.
Source: http://www.certified-equipment-appraisals.com/methods.html
English
NPV and EAC cases
English
Requires 100 POINTS in the General category. Is overage service equipment more cost saving than high speed machine?
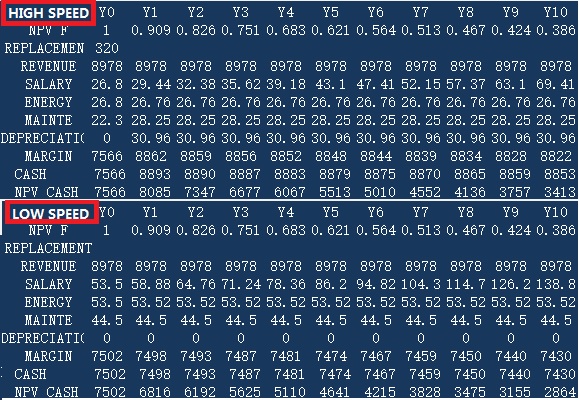 Some decision making people in enterprises may believe that the overage machine is more cost saving than new high speed one who think wrongly that the old machine saves the depreciation cost. But as we know that labor cost, depreciation, energy cost and maintenence fee are often take 80% of the operational cost and the four costs are often identical. So when we save the depreciation fee, we waste the other 3 costs at the same time which results that the operational cost using new devices is less than those using overaged one.
From the perspective of labor cost, every year it increases in a specific percentage. And for the seemingly unchanged depreciation, using NPV (Net present value), it decreases with the passage of time.
LOW SPEED (4500 packages per hour) machine in the left table is overaged one without depreciation anymore. HIHG SPEED (9000 packages per hour) machine has an additional replacement fee which is 3.2 million. And the currency unit in the left table is 10 thounds with the result that 3.2 million displays as 320 for example.
The comparison conditions are as the followings,
Maintenance fee for LOW SPEED is 4.6 and 6.6 for HIGH SPEED per 1000 running hours. Every year the running hours are 5000 hours. And the oerational cost divided by system cost is about 13%. Cost per package is 1.9. Margin per package is 5%. The cost in this processing unit takes 0.25 of the total plant cost. Salary increase rates per year is 10%. Business tax rate is 15%. NPV factor is 10%.
Then we have the calculation summarised as the left table. We can see that the absolute saving using high speed new machine is about 87million $ in 10 production year with a 16% saving than overaged one.
English
Net promotion score to know your customer
Net Promoter® Score (NPS) Survey
Want to know how loyal customers are? Curious to learn if your patients recommend you to others? Looking to make your clients are happy? Calculate your NPS score by asking “The Ultimate Question.” You’ll learn what your customers think—and a whole lot more.
Online NPS surveys
Whether you have patients, employees, or event attendees your Net Promoter Score gives you a quick way to get feedback by asking the ultimate question: “How likely is it that you would recommend this company to a friend or colleague?” If you’ve seen this question before, you’re already familiar with the easiest and fastest way to measure customer loyalty to your company, product, service, or brand.
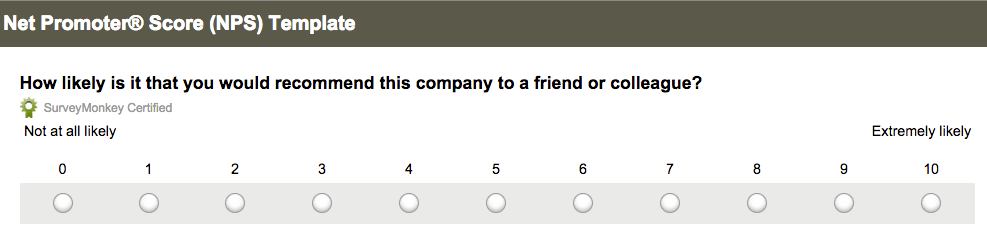
This Net Promoter Score questionnaire gets you the data you need to quickly understand what customers feel about your organization—and to react to any negative feedback. An NPS score also makes it easy to set both internal performance benchmarks, as well as external benchmarks to compare against competitors in your industry.
SurveyMonkey and NPS
Now you can create your Net Promoter survey, calculate your score, and get context for your results—all in one place. How? SurveyMonkey calculates your Net Promoter Score for you! When you get results from your Net Promoter survey, go to the Analyze section, and you’ll see a gauge that shows your overall Net Promoter Score. You’ll also find a data table with the number (and percentage) of Detractors, Passives, and Promoters among your respondents who are recommending you—and those who aren’t—so you can get the detail around how your NPS was calculated.
Net Promoter® Score Definition and Formula
The Net Promoter Score explained by survey experts.
 Working in marketing often means dealing with math, and the formulas can be mind-bogglingly complicated. At what point in the purchase funnel do you see the greatest amount of conversions? How many clicks on your blog come from organic sources? And at what time do those clicks seem to peak?
Performing all of those calculations can make your head spin. The Net Promoter® Score methodology is refreshingly simple by comparison. Instead of asking hundreds of online survey questions and doing in-depth calculations, you’ll ask one powerful question (and a few refining ones).
Then, you’ll perform just one calculation. And you’ll get an industry standard score, ranging from -100 to +100. (Learn how to do the Net Promoter Score calculation here. Or SurveyMonkey will calculate your NPS for you!)
A quick Net Promoter Score definition
In a standard customer satisfaction survey example, you might ask consumers to give specific feedback on the products and services you provide. Questions like: “How quickly did the customer service team assist you?” can help you understand what consumers really think, and as a result, these questions are very valuable.
And although there are benefits to customer satisfaction versus NPS, these sample survey questions might not provide you with all of the detail you need to improve your business.
Why? Because people who are satisfied might still leave. That’s right. They might appreciate your speed and your products and your price. But, they might be just as willing to switch to another company if they get a better deal. In other words, they may like you, but they may like others more.
The Net Promoter Score Bain developed in 2003 is designed to ask something a lot different. Instead of asking if your customers are happy, you’re asking your customers if they’re promoters of your company. You’re trying to determine if your customers are willing to speak up and speak out about your brand. In essence, you’ll see how many of the people you work with right now are willing to be brand advocates.
The math you do at the end of the questionnaire will provide you with one number that will show you just how many of your consumers are willing to do that advocacy for you. Here’s how it works.
Net Promoter Score methodology
The NPS sample survey starts with one very basic but very powerful basic question: “How likely is it that you would recommend this company to a friend or colleague?”
We’re cutting right to the chase here, asking people straight up if they intend to work as advocates, or if they don’t really plan on spreading the good news about your products or services.
This isn’t a yes/no question, either. Participants are asked to grade their responses on a scale from 0 to 10, with low scores indicating a complete lack of willingness to work as an advocate, and 10 as a very high likelihood of working as an advocate.
The follow-up questions allow you to gather just a bit more data. Here, you’re asking open-ended survey questions that could help you to understand why people are willing to speak up for you, and what might need to change in order to make advocacy more likely. You might ask:
- What changes would this company have to make for you to give it a higher rating?
- What changes would this company have to make for you to give it an even higher rating?
- What does this company do really well?
The open-ended nature of this online poll will give you the data you need in order to push your products, services, or approach in a different direction. But, there’s one more thing you can do with these results in order to help your company. And yes, there is a little math involved.
Working with the numbers
In order to come up with a score, or percentage, of promoters, you’ll return to the answers consumers provided to your original question. Specifically, you’ll be looking at that little 0 to 10 grade they gave your company when asked if they’d promote it. Those grades allow you to segment your consumers into three groups:
- Detractors. These consumers give rankings in the 0 to 6 range. These are the consumers who aren’t willing to speak up for your company at all. In fact, they might be downright hostile to your company.
- Passives. Rankings in the 7 to 8 range put consumers in this category. They might buy from your company on a regular basis, but they might also be willing to switch to someone else, if something better comes along.
- Promoters. Scores of 9 to 10 turn consumers into promoters, and these are the customers all businesses want. They’re loyal, they’re active and they’re willing to share. What could be better?
Once you’ve segmented your respondents into groups, you’re ready for math. Thankfully, it’s pretty easy. A Net Promoter Score definition, in simplest terms, is the percentage of detractors subtracted from the percentage of promoters. You’ll do this by following this simple formula:
(Number of Promoters — Number of Detractors) / (Number of Respondents) x 100
That’s it!
This simple calculation will allow you to see how many consumers are fans of your company, willing to give it a shout out.
The power of the Net Promoter Score explained
The detail you get in follow-up questions will be a key part of the marketing changes you do and do not make for your company. That much is clear. But the numeric score you get after doing a little basic math is intensely powerful. It’s a benchmarkable number you can use, year after year, to track your progress. And, you can even use that number to compare your success with the success of your competitors.
Net Promoter Score definition
What is the Net Promoter Score? The Net Promoter Score definition and formula is based on the following idea:
NPS is a highly regarded loyalty metric that people at companies like yours use to collect the customer feedback they need to inform their business strategy. It's seen by many as a better indicator of customer loyalty than traditional customer satisfaction surveys.
The Net Promoter Score question
The Net Promoter Score methodology is based on asking customers a single question that predicts the likelihood of both repurchase and referral: “How likely is it that you would recommend this company to a friend or colleague?” Customers rate their answers on a scale from 0 to 10.
The answers customers provide are classified as follows:
- 0–6 = Detractors—unhappy customers who can hurt your brand through negative word-of-mouth
- 7–8 = Passives—satisfied but indifferent customers who could be swayed by the competition
- 9–10 = Promoters—loyal customers who will keep buying and referring others
How to get your Net Promoter score
Sending NPS surveys to your customers can be really easy if you make a habit of it. Choose important touchpoints (like when you complete a sale), or send surveys by email on an ongoing basis. You can even automate your NPS surveys. See how we can help.
Why use NPS?
When you ask customers the Net Promoter Score question, you’re essentially asking them whether or not they’re taking the time to say positive things about your company or brand. Because when it comes right down to it, word of mouth is everything—especially today, as opinions spread faster via social channels and online forums and reviews.
Finding out your Net Promoter Score is the easiest way to see how your company is doing in the eyes of your customers. Historically, the positive NPS scores have showed strong correlations to profitable growth. Companies and organizations ranging from small start-ups to some of the world’s largest corporations also use the NPS to assess customer satisfaction and track performance because it’s:
- Simple and quick. One question is all it takes to determine your Net Promoter Score—and it's easy to calculate. With our Net Promoter Score template, you can set up and send your survey in minutes.
- Quantifiable. Management can see how well your company is performing with one simple metric. The NPS introduces common terminologies that are easy to understand by everyone.
- Standardized. Widely known as the standard for measuring and improving customer loyalty, the NPS is trusted by brands like American Express, Apple, GE, JetBlue, and Kaiser Permanente.
- Benchmarkable. One of the most valuable benefits is the ability to see how your organization stacks up against the competition. Because hundreds of companies using NPS, you have a yardstick to measure and track your performance internally and against external NPS benchmarks.
Ways to use NPS
Although there are pros and cons to NPS, getting your NPS helps you understand how you compare against the competition—and find out what the big brands in your industry are scoring.
While you’re continuously monitoring your customer loyalty ratings with NPS to make internal changes to your organization, you can also get external NPS benchmarks to understand if your Net Promoter Score is good or bad.
For example: If your Net Promoter Score is 36, what does that really mean? A score of 36 may not seem great to you. But an NPS of 36 could actually be a strong score when compared with the average Net Promoter Score for organizations in your industry.
With SurveyMonkey Benchmarks, you get context for your Net Promoter Score. Hundreds of companies use our NPS template to measure customer loyalty and improve business outcomes. Our data is diverse, covering everything from small organizations to large corporations and a broad range of industries.
Net Promoter Score calculation
Here are 5 simple steps to calculate your Net Promoter Score:
-
Send the Net Promoter Score Questionnaire to your target demographic.
-
Download your survey responses into an Excel spreadsheet.
-
Within your spreadsheet, identify your respondents as Detractors, Passives and Promoters by adding up the total responses from each classification.
-
Generate the percentage total of each group by taking the group total and dividing it by the total survey responses.
-
Subtract the percentage total of Detractors from the percentage total of Promoters and this is your NPS.
If it makes it easier, the equation for calculating a Net Promoter Score looks like this:
(Number of Promoters — Number of Detractors)
(Number of Respondents)
X 100
Example: If you received 100 responses to your survey:
10 responses were in the 0–6 range (Detractors)
20 responses were in the 7–8 range (Passives)
70 responses were in the 9–10 range (Promoters)
Calculating the percentages for each group gives you 10%, 20%, and 70% respectively.
Subtract 10% (Detractors) from 70% (Promoters), which equals 60%. Since a Net Promoter Score is always shown as just an integer and not a percentage, your NPS is simply 60.
The history of NPS
Pioneered by Fred Reichheld, author of The Ultimate Question, the NPS is a customer loyalty metric that predicts the likelihood of a customer repurchasing from you or referring your company to a friend. Introduced in 2003, Net Promoter Scores can range from as low as –100 (when every customer is a Detractor) to as high as 100 (when every customer is a Promoter).
English
Outsourcing model
Contractors are used by many departments to perform asset related work. A set of policies and procedures to guide all contractor related work should therefore be developed for the whole organisation. At lower maturity levels the requirements are mainly driven by Finance from a financial control perspective. All contracts and contractors are also managed in the same fashion. At higher maturity levels contractors and contracts are categorised and managed accordingly. And the contracts are reviewed periodically.
Before we carry on with managing contractors, first a quick look at some reasons for using contractors in the first place.The results shown here are from an AM outsourcing study conducted. A number of organisations were asked to list the reasons why do they outsource certain AM work or functions. The 80% grouping lists the most popular reasons. Ask the delegates on the course to have a look at the 20% list. Although some of the reasons are very valid, some put forward are actually not good reasons for outsourcing. See if the delegates can identify some of these reasons. [reduce management effort; reduce risk; reduce influence of trade unions]
As part of the study the organisations were also asked to comment on why they dont outsource certain AM work. The reasons for keeping it in-house are as follows:
•Perceived benefit of running things in-house – driven by poor supplier management and bargaining or lack of real competition in service provision
•Activities/functions came as baggage after an acquisition or merger without proper consideration of its viability
•Pure size was a goal – driven by ego, regardless of the actual nature of the operations
•Some degree of vertical integration was pursued as manufacturers sought to control the value chain, often with good intentions at the time (reliability)
•Divisional heads were allowed to build empires without due regard to the true corporate goals and vision
What are the criteria for making an outsourcing decision? Do we do it ourselves, or can we outsource?
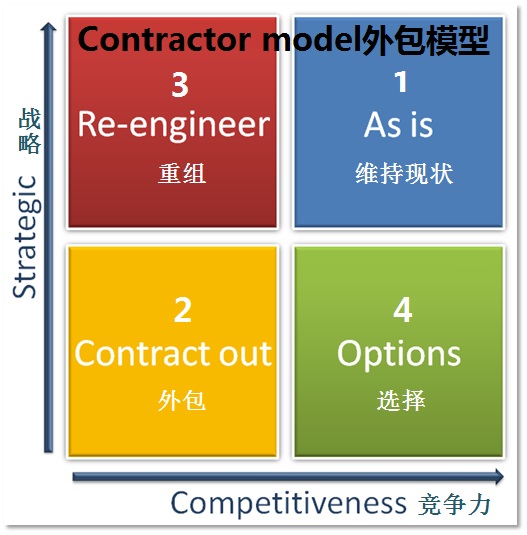 The model presented here is a simple but effective example of the evaluation that should be considered prior to outsourcing work. The two criteria here are:
•Strategic or non-strategic
How important is this activity to the organisation in achieving long-term competitive advantage in its chosen marketplace?
•Competitive or non-competitive
How competitively (competently) is the function being performed compared to the external competitive marketplace?
Based on the outcomes of these answers, the following can be suggested:
•C, S
Retain the status quo
•N-S, N-C
Little value in investing to improve this function
Outsource these functions
•S, N-C
Should not outsource these functions in the long run
Instead, re-engineer to ensure that they are performed at a competitive cost, quality and speed
•N-S, C
Sell the function as a going concern
Extend the function to provide services to external clients
Outsource the function
Raise the profile of the function to turn it into a source of strategic competitive advantage
Should all contracts or contractors be managed in the same fashion?
As with Material Management and Asset Care Plans, we often need to focus our attention to manage the most critical issues the best. In the mentioned KPAs we classified spares and assets respectively in ABC groupings, and them developed an approach per group or ca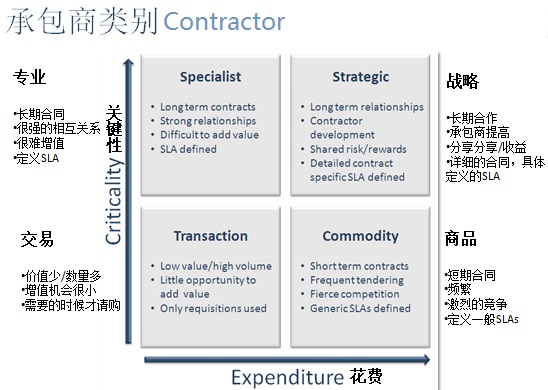 tegory. The same is recommended for contractors and contracts. Here this part introduces the concept of contractor categories, in this case 4 categories based on criticality and cost of service. The four categories created can be described as follows:
•Strategic
Provide high level goods, services or functionality that is not readily available from the market place
•Specialist
Also provides high level goods, services of functionality, but their importance is not apparent from relative low level expenditure
•Commodity
Expenditure may be high but the importance is low when the commodity is readily available
•Transaction
High number of contractors but low expenditure
Important to develop an approach per each of these categories.
Represented here is the typical outcome of grouping an organisation’s contractors/contracts among the categories. Take note that only 2% of the contractors/contracts fall within the strategic group, yet it accounts for 50% of the expenditure.
So where do you start managing contractors more closely?
You start by creating detailed procedures and requirements for the Strategic Group. Once under control, your attention can move to the Specialist or Commodity Groups. As for the transactional group – it only represent 5% of expenditure, so you should get away with limited controls without increasing your risk exposure.
English
Points store (Registration Required)

Digital Products cannot be downloaded unless you have a registration and logged in.
Points store is not only a simple store but also an information and goods sharing platform related to society, efficiency, culture, art and living etc. Sharing is appreciated by awarding points with which you can buy other goods here or change it directly into cash. The things can be shared including news, articles, images, video, books and goods etc. (About 1 US dollar equals 96 points.)
English
Buy POINTS
$1.09

Buy POINTS to visit POINTS priced page or exchange gifts in POINTS Store.
English
图像:

Buy downloadable files
English
Movie: clean round the Bend
$9.44
 Clean Round The Bend is a FLV movie introducing the pipeline clean or CIP (Clean in place) affecting factors such as flow speed, flow direction, L/D value etc. It also simulates different clean result when using different clean parameters which is a very good practice education movie related to pipeline CIP in water, beverages, oil, milk and wine etc manufacturing plant.
English
图像:

Movie: microbes with human life
$4.64
 It is a vivid introduction of microbes with human being life related to atibiotics, birth of soap, microbes on human body, use bacteria to make cheese, dagerous flesh eating bacteria, killing human virus, bateria toxin etc.
English
图像:

eBooks Room
English
eBook: Quality management-Aseptic production
$13.58
English

The intention of this book is to present some of the knowledgeacquired during many years of practical work on the qualitycontrol and quality assurance of long-life products. Differentfactors have an impact on product quality – the standard of the rawmaterials, the equipment involved, the processes applied, opera-tional procedures, installation, and so on. In order to produce ahigh quality product, a thorough understanding of these factors isnecessary. An attempt has been made to discuss and present thematerial in a comprehensible way concentrating on microbio-logical aspects. The HACCP (QACP) concept has been used as amodel for process control.UHT-treated and aseptically packaged products have beenproduced in large quantities for quite some time. So far, the litera-ture available concentrates on particular aspects of product andequipment characteristics and the technology involved. A moregeneral presentation appears to be lacking. Hopefully, our workwill help close the gap.To a large extent, the available “old” literature has beenconsulted. The new literature is readily accessible through dataprofile searches. In addition, more than 25 years of practical fieldexperience has gone into this study.The different topics are arranged in such a way that each chap-ter stands as an independent entity. Of necessity, this has led tosome repetitions. We hope that the reader will accept the problemand make allowances for the consequences. It is also our hope thatthis study will contribute to the production of long-life productswith a high level of quality.Finally, we would like to express our appreciation to all theTetra Pak people who have helped to prepare this book and whohave contributed with valuable comments on the contents. Thisapplies particularly to Gösta Odelberg B. Sc., Regional ManagerFiSQA (Field Service Quality Assurance) and Dr. Charles Sizer.Åkarp, August 1998Dr. Bernhard von Bockelmann Dr. Irene von Bockelmann
Product category:
图像:

eBook:Knockout Job Interview Presentations
$0.73
English

Product category:
图像:

ebook: 42 rules for driving success with books
$0.84
English
 ."I always say that in order to achieve success you must first buildvisibility and then credibility; only then can you move forward intoprofitability.In '42 Rules for Driving Success with Books,' MitchellLevy explains how becoming a published author is the ultimate way tobuild visibility and credibility by branding yourself as an expert whichwill inevitably build your business.Simply put, this book is anessential read for anyone wishing to attain a higher degree ofsuccess."Ivan Misner, NY Times Bestselling author and Founder of BNI
Product category:
图像:

ebook: Aseptic production Chinese version
$13.58
English
这是Bernhard von Bockelmann与Dr. Irene von Bockelmann对乳品工业UHT生产技术质量管理的心血与贡献。其中详尽阐述UHT加工原理,无菌产品技术,质量管理包括QA与泊松分布抽样检验等,对果汁等的UHT加工也做了简要叙述。
Product category:
图像:

ebook: Dairy processing handbook Chinese version
$14.17
English

目录
第一章 牛乳的生产⋯⋯⋯⋯⋯⋯⋯⋯⋯⋯⋯⋯⋯⋯⋯⋯⋯⋯1
第二章 乳品化学⋯⋯⋯⋯⋯⋯⋯⋯⋯⋯⋯⋯⋯⋯⋯⋯⋯⋯⋯13
第三章 流变学⋯⋯⋯⋯⋯⋯⋯⋯⋯⋯⋯⋯⋯⋯⋯⋯⋯⋯⋯⋯37
第四章 微生物⋯⋯⋯⋯⋯⋯⋯⋯⋯⋯⋯⋯⋯⋯⋯⋯⋯⋯⋯⋯45
第五章 牛奶的验收和贮存⋯⋯⋯⋯⋯⋯⋯⋯⋯⋯⋯⋯⋯⋯⋯65
第六章 乳品加工的工艺设施⋯⋯⋯⋯⋯⋯⋯⋯⋯⋯⋯⋯⋯⋯73
6.1 热交换⋯⋯⋯⋯⋯⋯⋯⋯⋯⋯⋯⋯⋯⋯⋯⋯⋯⋯⋯⋯74
6.2 离心分离机和牛乳脂肪标准化⋯⋯⋯⋯⋯⋯⋯⋯⋯⋯89
6.3 均质机⋯⋯⋯⋯⋯⋯⋯⋯⋯⋯⋯⋯⋯⋯⋯⋯⋯⋯⋯⋯112
6.4 膜滤⋯⋯⋯⋯⋯⋯⋯⋯⋯⋯⋯⋯⋯⋯⋯⋯⋯⋯⋯⋯⋯120
6.5 蒸发器⋯⋯⋯⋯⋯⋯⋯⋯⋯⋯⋯⋯⋯⋯⋯⋯⋯⋯⋯⋯130
6.6 脱气罐⋯⋯⋯⋯⋯⋯⋯⋯⋯⋯⋯⋯⋯⋯⋯⋯⋯⋯⋯⋯136
6.7 泵⋯⋯⋯⋯⋯⋯⋯⋯⋯⋯⋯⋯⋯⋯⋯⋯⋯⋯⋯⋯⋯⋯139
6.8 管道、阀门和安装管件⋯⋯⋯⋯⋯⋯⋯⋯⋯⋯⋯⋯⋯148
6.9 罐⋯⋯⋯⋯⋯⋯⋯⋯⋯⋯⋯⋯⋯⋯⋯⋯⋯⋯⋯⋯⋯⋯156
6.10 工艺控制⋯⋯⋯⋯⋯⋯⋯⋯⋯⋯⋯⋯⋯⋯⋯⋯⋯⋯⋯159
6.11 服务系统⋯⋯⋯⋯⋯⋯⋯⋯⋯⋯⋯⋯⋯⋯⋯⋯⋯⋯⋯169
第七章 设计一条生产线⋯⋯⋯⋯⋯⋯⋯⋯⋯⋯⋯⋯⋯⋯⋯⋯182
第八章 巴氏消毒乳产品⋯⋯⋯⋯⋯⋯⋯⋯⋯⋯⋯⋯⋯⋯⋯⋯194
第九章 长期保存鲜奶⋯⋯⋯⋯⋯⋯⋯⋯⋯⋯⋯⋯⋯⋯⋯⋯⋯208
第十章 发酵剂制作⋯⋯⋯⋯⋯⋯⋯⋯⋯⋯⋯⋯⋯⋯⋯⋯⋯⋯226
第十一章 发酵乳制品⋯⋯⋯⋯⋯⋯⋯⋯⋯⋯⋯⋯⋯⋯⋯⋯⋯⋯234
第十二章 奶油和涂布乳制品⋯⋯⋯⋯⋯⋯⋯⋯⋯⋯⋯⋯⋯⋯⋯256
第十三章 无水乳脂(AMF) (奶油脂肪)⋯⋯⋯⋯⋯⋯⋯⋯⋯⋯⋯272
第十四章 干酪⋯⋯⋯⋯⋯⋯⋯⋯⋯⋯⋯⋯⋯⋯⋯⋯⋯⋯⋯⋯⋯279
第十五章 乳清加工⋯⋯⋯⋯⋯⋯⋯⋯⋯⋯⋯⋯⋯⋯⋯⋯⋯⋯⋯322
第十六章 炼乳⋯⋯⋯⋯⋯⋯⋯⋯⋯⋯⋯⋯⋯⋯⋯⋯⋯⋯⋯⋯⋯343
第十七章 奶粉⋯⋯⋯⋯⋯⋯⋯⋯⋯⋯⋯⋯⋯⋯⋯⋯⋯⋯⋯⋯⋯350
第十八章 奶粉的包装⋯⋯⋯⋯⋯⋯⋯⋯⋯⋯⋯⋯⋯⋯⋯⋯⋯⋯361
第十九章 冰洪淋⋯⋯⋯⋯⋯⋯⋯⋯⋯⋯⋯⋯⋯⋯⋯⋯⋯⋯⋯⋯373
第二十章 干酪素⋯⋯⋯⋯⋯⋯⋯⋯⋯⋯⋯⋯⋯⋯⋯⋯⋯⋯⋯⋯382
第二十一章 乳品设备的清洗⋯⋯⋯⋯⋯⋯⋯⋯⋯⋯⋯⋯⋯⋯⋯⋯390
第二十二章 乳品厂废水⋯⋯⋯⋯⋯⋯⋯⋯⋯⋯⋯⋯⋯⋯⋯⋯⋯⋯401
Product category:
图像:

ebook: Dairy processing handbook English version
$18.92
English

Contents
1Primary production of milk1
2The chemistry of milk13
3Rheology37
4Micro-organisms45
5Collection and reception of milk65
6Building-blocks of dairy processing73
6.1Heat exchangers75
6.2Centrifugal separators andmilk fat standardisation systems91
6.3Homogenisers115
6.4Membrane filters123
6.5Evaporators133
6.6Deaerators139
6.7Pumps143
6.8Pipes, valves and fittings153
6.9Tanks161
6.10Process Control165
6.11Service systems175
7Designing a process line189
8Pasteurised milk products201
9Longlife milk215
10Cultures and starter manufacture233
11Cultured milk products241
12Butter and dairy spreads263
13Anhydrous milk fat279
14Cheese287
15Whey processing331
16Condensed milk353
17Milk powder361
18Recombined milk products375
19Ice cream385
20Casein395
21Cleaning of dairy equipment403
22Dairy effluents415
Literature425
Index427
Product category:
图像:


ebook: Living like you mean it
$1.20
English
 Use the wisdom and power of your emotions to get the life you really want
Product category:
图像:

ebook: Say it right the first time-leader's skill to communicate and manage people
$1.15
English
 There are many different ways to produce high-performance resultsin organizations. Some companies create an internally competitiveenvironment where the toughest, but not necessarily the most com-petent, rise to the top. Other organizations build a consensus culturewhere agreement replaces quality by reducing decisions to the lowestcommon denominator. Organizations of the future, however, arechoosing a longer-term approach to producing results by investing inpeople. The most prized possession in these companies is the highlevel of accountabilityand collaborationamong people. People areplaced at the heart of the organization, and leaders recognize that theirmost important resource walks through the front door every day andwill walk out again if they are uninspired.This book is for leaders and managers at all levels who believe thathow people work togetheris the key to long-term success. Several prem-ises underlie this belief:1.People want to do their best.2.People will give their discretionary effort when they areinspired 3.People will produce unprecedented results with inspiredleadership.Communication, language in particular, is the vehicle for unleash-ing the power of people. This is the tool that leaders use to either moti-vate people to reach higher or to derail them completely. Words arepotent. They move the action forward or backward; there is no suchthing as a neutral comment from a leader. All words have meaning andimpact. Leaders who understand this can use language to harness theboundless energy of people toward focused business outcomes. Thosewho fail to recognize the power of their words will find themselvesfrustrated with the constant cycle of rework and communicationbreakdowns. The truth is that leadership competence, expertise, andcommitment will not overcome poor communication skills.Most competent leaders and managers have been schooled, bothformally and informally, in many different facets of leadership. Butfew have had the opportunity to learn how words shape reality anddetermine both their future and the future of the organization. Thisbook closes the gap by providing leaders with much more than justtools; it explains why the tools workso leaders can easily apply power-ful communication principles to the many challenges they face.Because words are potent, this book does not waste them. It is tothe point, practical, and direct. No time is wasted on theory, academicresearch, or ego massage. This book is specifically designed for lead-ers and managers who are already successful and who want to achievemuch more through their best resource people.
Product category:
图像:

ebook: Successful Interview Skills
$1.04
English
 1 The interview 7What is an interview? 7; Types of interview 8; Other assessment methods 10; Why do interviews take place? 11; What happens in an interview? 12; What are interviews about? 13; What leads to success in interviews? 132 What employers are looking for 17Providing proof that you are the right candidate 18; The most common mistakes 21; De-mystifying the interview 23; Stressing your contribution 243 Planning and preparation 27Importance of planning and preparation 27; Yourview of yourself 28; How you see the employer 28; Research 29; Analysing the job 31; How to find out more 32; Areas of likely questioning 35; Mind the gap! Covering up your weak spots 39; Maximising your strengths 39; Golden rules 40; Which questions toask? 414 Creating the best impression 45The importance of personal image 45; Creating apositive first impression 46; Appearance 48;
Product category:
图像:

ebook: The Principles of Project Management
$2.12
English
 Growing up, I didn’t want to be a project manager. Unlike the more popular options of fireman and ballerina (and later doctor and chef), it wasn’t as easy to visualize what being a project manager was all about. Since my love was for technology, I studied Computer Science and worked on everything from software engineering through to web development. It was only in the corporate world that I realized why people wanted to be project managers.
Project management is about making things happen.
Good project management is what makes the real work a success. Bad or missing project management can taint and nullify the efforts of even the most talented people. It doesn’t matter how brilliant your work is if the project as a whole is twice as ex-pensive as intended, or a year late. This is not to say that the real work isn’t import-ant—it is still the core of any project. No project manager can make mediocre work into an awesome end result. But fantastic work can be overlooked if the project management required to deliver the whole isn’t there.
Like me, you’ve probably already realized this. You’ve worked on a project or two where things went wrong at the project management level. You’ve figured you could do a better job of it yourself—which is exactly why you bought this book! The good news is that you were right. You can do a good job of the project management. And this book will teach you how.
Who Should Read This Book?
This book is for anyone who wants to learn enough project management to ensure their projects succeed. You won’t become a world authority on the project manage-ment discipline, but you will become an effective and efficient project manager. Although some of the examples in this book focus on projects that address techno-logical or systems-related issues—a growing industry in need of skilled project managers!—the book is intended for anyone who needs to manage projects of any sort.
That said, this book won’t teach you to manage the construction of the next space shuttle. For very large and very complex projects, you will probably need a few extra and more rigorous tools. You’ll find some pointers to such tools in the appen-dices.
Product category:
图像:

ebook: dealing with difficult people
$1.23
English
 This is not a book to be read from cover to cover. It is not War and Peace, although with a bit of luck it will give you some ideas on how to have more peace than war.It is a book to dip into, look for the character or situation you’re having problems with, find a solution, apply it and move on. Life is too short to spend it having a row with people.This is a book to scribble on the pages, rip bits out and do all the things with that your old school would give you detention for! This is a source book but not a reference book. A book to dive into but not to get immersed in.This is a book you can use to improve your own performance or use as a source of ideas to work in groups to improve the performance of your team.If all else fails it is a book just heavy enough to throw at someone who is being really difficult, without the risk of doing them any serious damage!To the uninitiated, difficult people can be the bane of your life, a blot on your landscape and a real pain to work with. This book is designed to help you to enjoy difficult people. Once you have the key, you can unlock them, influence them, get them working for you and they'll never notice.
Product category:
图像:

ebook: leadership the hard way
$1.38
English
Every now and then, a person of great wisdom and integrity comes along with a story that everyone needs to hear. Dov Frohman is such a person. As a maverick in the fi eld of technology from the earliest days, Dov has been an innovator, a questioner, a radical, a champion, a sage, a survivor, and above all, a leader. He’s never backed down from responsibility, and he’s faced some hair-raising crises with unconventional methods and achieved undeniable results. Under his guidance, Intel Israel became a key part of the global company’s success and helped make Israel a real player in the world’s high-tech market. Even if this were solely a book of his personal stories, it would be a very worthwhile read. These stories are highly engaging and provide an insider’s view into one of the most competitive indus-tries in the world, not to mention harrowing tales like his child-hood spent in hiding in Nazi-occupied Holland or his decision to keep Intel Israel open during the fi rst Gulf War, as Scuds were raining down around the country. It was a highly risky and contro-versial move, yet one characteristic of Dov’s commitment to his company and his country. Fortunately for us, however, this book is much more than a memoir. Dov’s unique experiences have given him a perspective on leadership you won’t fi nd anywhere else, and he’s spent many years refl ecting on the most critical issues any leader or leader-to-be might encounter. This book is like having a personal mentor—someone who tells the truth about leadership, the good and the bad, the easy calls, and the thorny dilemmas. Dov has stood in the trenches, weathered the loneliness along with the accolades, and really dug deep into the role, and now we the readers get the benefi t of his insights, which are by no means rote and always authentic. We rarely see this kind of transparency from our leaders, so take advantage of it while you can.
 Book contents:
Introduction: Flying Through a Thunderstorm
Chapter 1: INSISTING ON SURVIVAL
Chapter 2: LEADING AGAINST THE CURRENT
Chapter 3: LEVERAGING RANDOM OPPORTUNITIES
Chapter 4: LEADERSHIP UNDER FIRE
Chapter 5: THE SOFT SKILLS OF HARD LEADERSHIP
Chapter 6: MAKING VALUES REAL
Chapter 7: BOOTSTRAPPING LEADERSHIP
Product category:
图像:

ebook: production and operations management
$3.03
English
 The second edition of the book Production and Operations Management incorporatesseveral suggestions offered by our colleagues and students all over the country.In this edition we have endeavored to strengthen the basic characteristics of the book. Thesubject matter has been presented systematically in ten chapters, which can enable the reader tomaster the topics covered without any additional guidance. In keeping with the basic objective ofmaking the learning of the ‘Concept and Principles in Production and Operations Management’, thefollowing chapters have been revised as per the suggestions.Chapter 1 on Introduction to POM was revised with the addition of Managing GlobalOperations with the concept of globalization. Chapter 2 on Plant Location and Layout wasrevised with locational models and the design of product and process layout. Service layout wasalso included. Chapter 4 on Materials Management was revised with the addition of specialpurchasing system. Chapter 6 on Quality Control was revised with the addition of ISO 14000series along with the recognized bodies for ISO certification. Chapter 8 on MaintenanceManagement was revised with the concept of Total Preventive Maintenance.The revised edition also contains Caselets which provides additional input to understand thesubject with practical application of the techniques used in each chapter.For the development of application skill of the theoretical knowledge of production and operationmanagement, it is necessary to arrange for a visit or conduct the project work either by individualor group of students in a manufacturing or service organisation.In this context the revised edition contains skill development/practicals in each chapter. Forthis purpose the students are adviced to visit a Fast Food Restaurant like Pizza Hut or Pizza Cornerfor getting the information for the questions given under skill development in each chapter.In addition to the caselet, cases are given to understand the entire concept of production andoperations management at the end of the book.Complete care has been taken to make the book error free. However, mistakes might havecrept inadvertently. Readers finding any error are requested to bring it to our notice, for enablingus to rectify them in our future editions.We are grateful to New Age International (P) Limited, Publishers, and the editorial departmentfor their untiring effort to publish the book within a short span of time with a nice get up.Our acknowledgements are also due to Dr. Poornima Anil Kumar and Mrs. BharathiSuresh, without whose support and sacrifice this work would not have been completed by thedeadline.Finally, our acknowledgement is due to the Almighty who has blessed us with the knowledge,required for writing this book.
AUTHORS: S ANIL KUMAR N. SURESH
Product category:
图像:

ebook: seven habits
$2.05
English
 Stephen Covey has written a remarkable book about the human condition, so elegantly written, so understanding of our embedded concerns, so useful for our organization and personal lives, that it's going to be my gift to everyone I know. -- Warren Bennis, author of On Becoming a Leader I've never known any teacher or mentor on improving personal effectiveness to generate such an overwhelmingly positive reaction.... This book captures beautifully Stephen's philosophy of principles. I think anyone reading it will quickly understand the enormous reaction I and others have had to Dr. Covey's teachings. -- John Pepper, President, Procter and Gamble Stephen Covey is an American Socrates, opening your mind to the 'permanent things' -- values, family, relationships, communicating. -- Brian Tracy, author of Psychology of Achievement Stephen R. Covey's book teaches with power, conviction, and feeling. Both the content and the methodology of these principles form a solid foundation for effective communication. As an educator, I think this book to be a significant addition to my library. -- William Rolfe Kerr, Utah Commissioner of Higher Education Few students of management and organization -- and people -- have thought as long and hard about first principles as Stephen Covey. In The Seven Habits of Highly Effective People, he offers us an opportunity, not a how-to guide. The opportunity is to explore ourselves and our impact on others, and to do so by taking advantage of his profound insights. It is a wonderful book that could change your life.
Product category:
图像:
ebook:Work for fun 3 simple steps for turning any hobby or interest into cash
$1.94
English
 Will Work for Fun presents a simple three-step process for turning your favorite hobby or interest into a reliable source of income. Why stay trapped in a job you hate, when you could turn your fun into your job? No matter what your interests are, Alan Bechtold will show you how to what you love into a real moneymaking career. Packed with stories, examples, exercises, and links to online resources, Will Work for Fun is the cure for another dull day at the office.
Product category:
图像: