Supply chain Optimization
Requires 100000 POINTS in the General category.1.1Plant Logistic Process's huge impact on cost
Requires 100000 POINTS in the General category.1.2Losses and KPI introduction
Requires 100000 POINTS in the General category.1.2.1Key performance indicators in Logistics
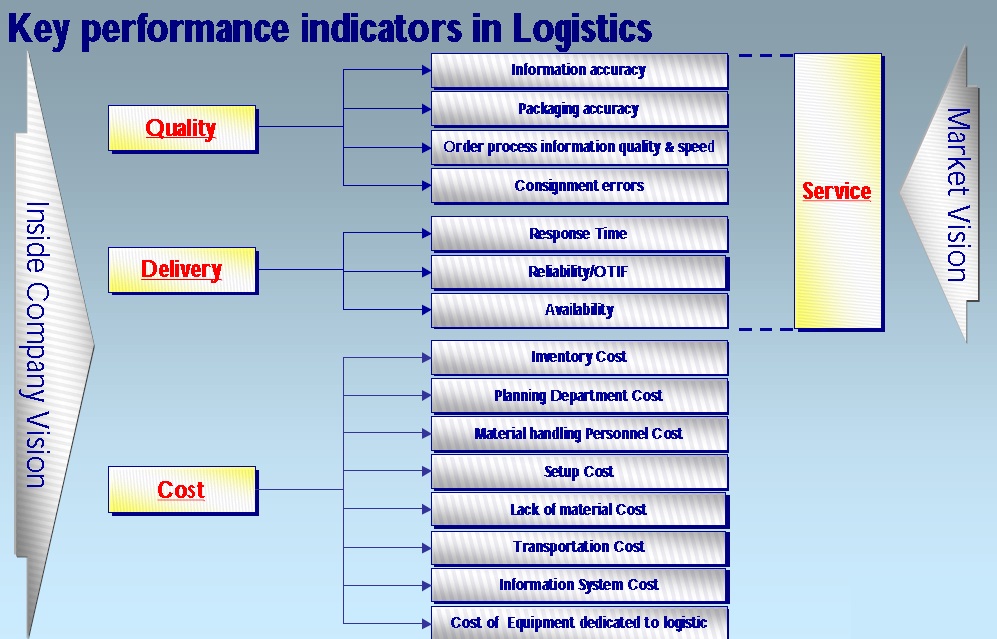
The cost, quality and delivery of logistics should be considered in this chapter.
1.2.2Total logistic cost and examples
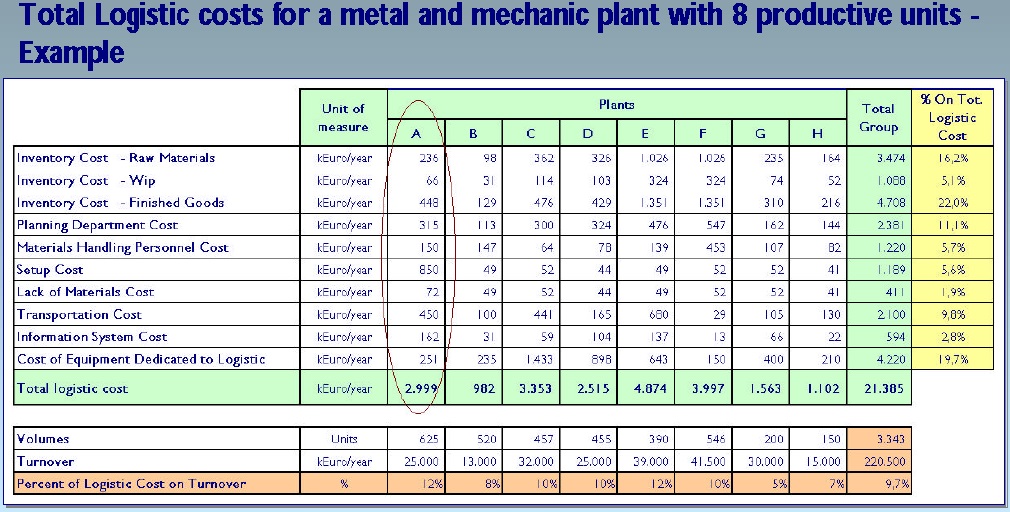
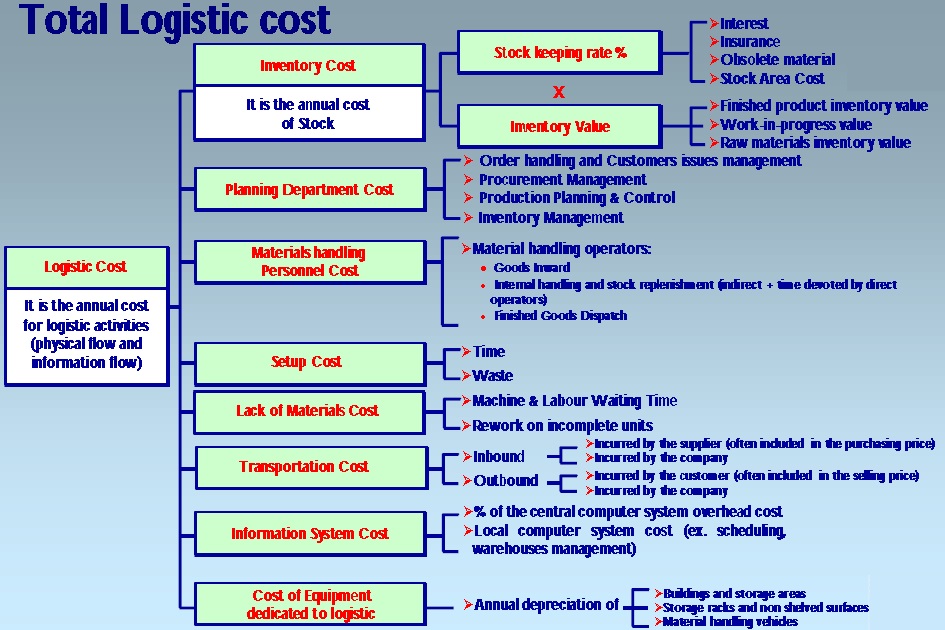
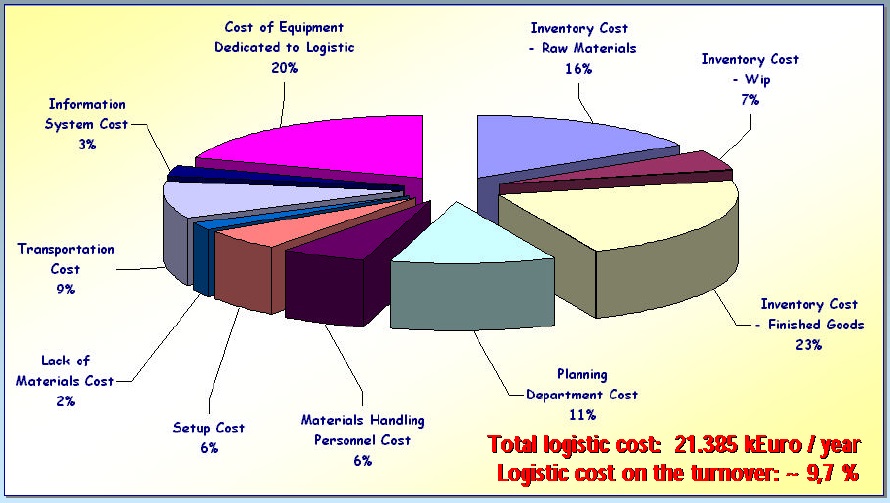
Such as inventory level cost, preparation or setup cost, personnel cost, facilitation cost, forcast cost and transportation cost etc.
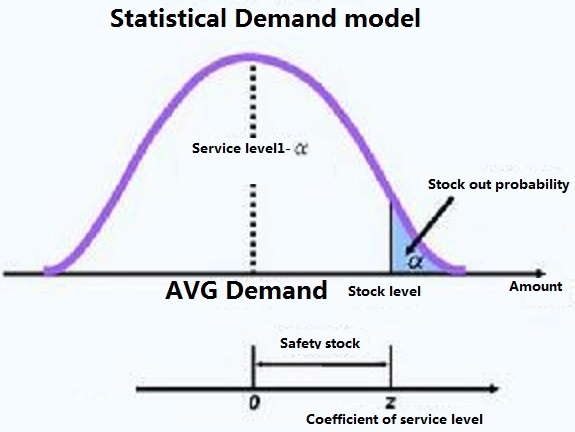
1.2.3Service level
Service level Definition
It’s a measure of Customer Satisfaction. It is the compliance to customer requirements or needs along the different service dimensions. Each process of the Supply Chain has a service level to be assured to the downstream processes in order to ensure the same service dimensions to be guaranteed by the entire company to the final customer.
Each process has its own Service Level requirements.
Customer Relationship.
1. Answer the phone within 2 rings.
2. Speak in a calm and courteous tone of voice.
3. Present yourself, clearly indicating the name of the company.
4. Take notes in a special notepad during the phone call.
5. Try to calm the caller's anger.
6. Listen to what is being said as though you personally care.
7. Don't interrupt the caller while he/she is speaking.
8. When the caller has finished speaking,briefly sum up the reason for his/her call and request confirmation.
Business positioning is to be coherent with customer's needs and competitive advantage on key competitors.
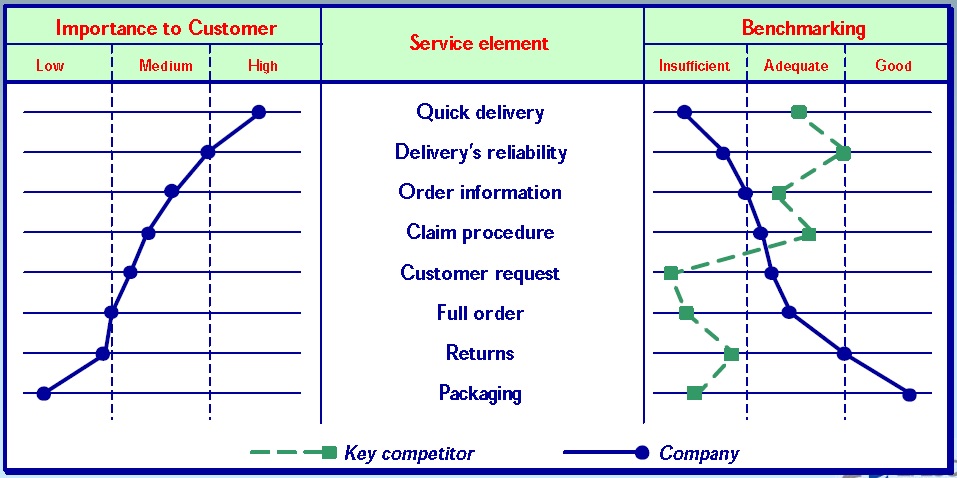 We can identify 3 main dimensions allowing Service Level evaluation:
Response time
Reliability/OTIF (On Time In Full)
Availability
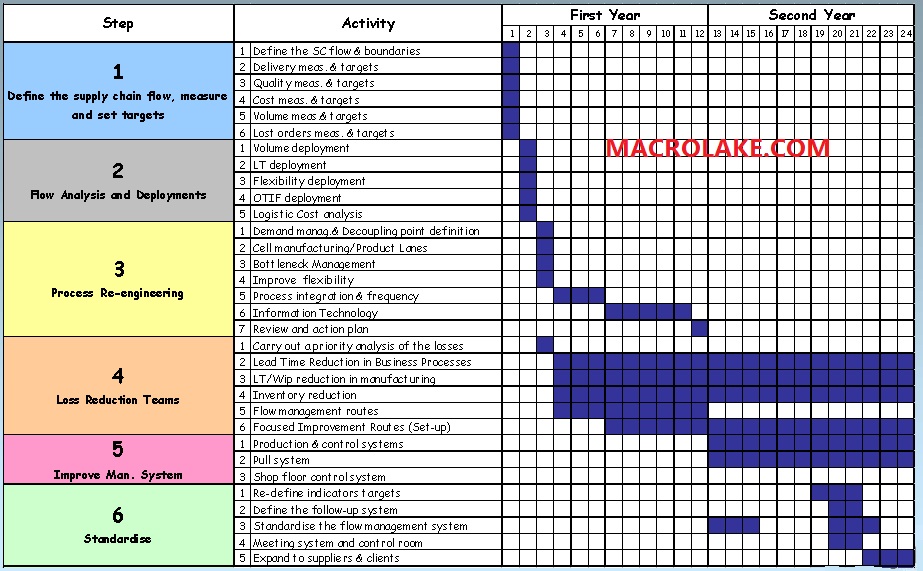
1.3General route of lead time reduction
Requires 100000 POINTS in the General category.1.4Two year plan of lead time reduction
2.1Planning and MPS(Major production schedule)
Planning definition
It is a "contract" between Sales and Production
It covers a short/medium-term period ( 1 - 6 months) with weekly itemization
Deciding
what to produce
which batches
sequences to adopt so as to allow production launch and material management(production capacity utilization)
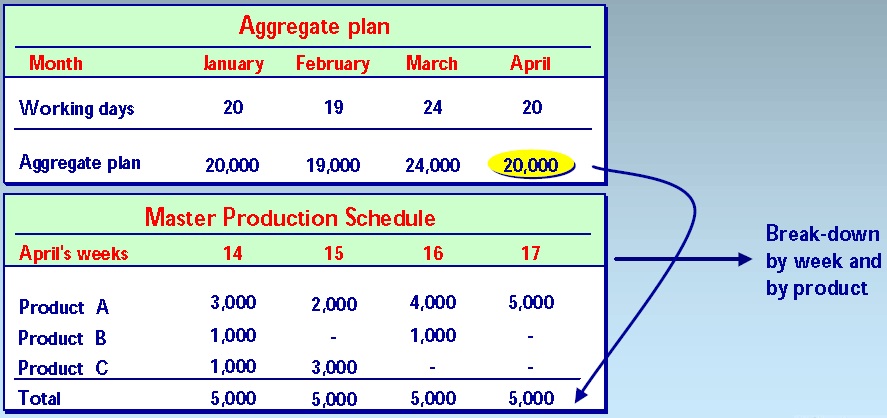
It breaks the aggregate plan down into specific items with a higher level of detail on products and schedules
It acts as a buffer between Sales and Production
It steers the whole production and material management system
It drives purchasing and capacity checks
It provides information on customer order processing
Relationship between aggregate plan and Master Production Schedule
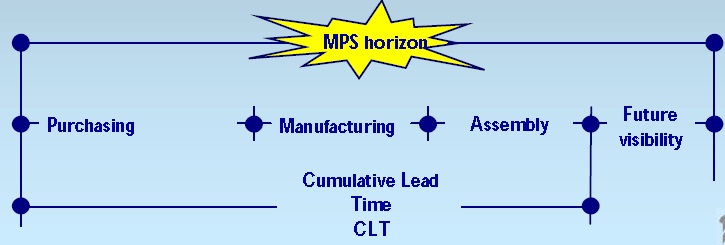
Planning horizon
The Master Production Schedule is developed for a period of time called" planning horizon".
The "planning horizon" should at least be as long as the longest cumulated lead time (CLT) plus a period of future "visibility".
Cumulated lead time is the longest period of time required to carry out product-making activities and it can be determined from the product's "timing" structure (bill of materials) by looking for the longest throughput time for each production step.
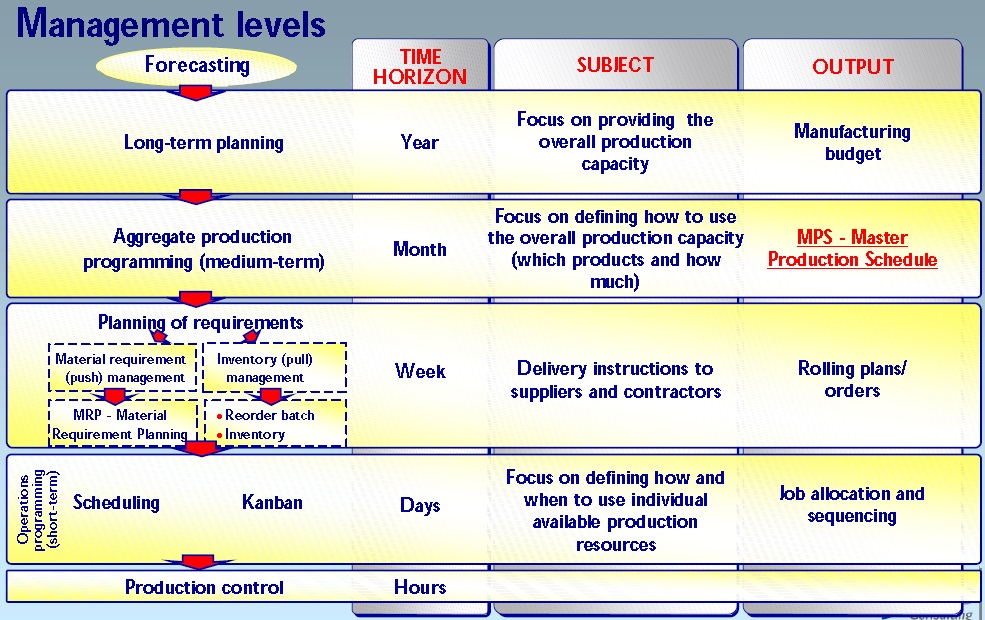
Planning hierarchy
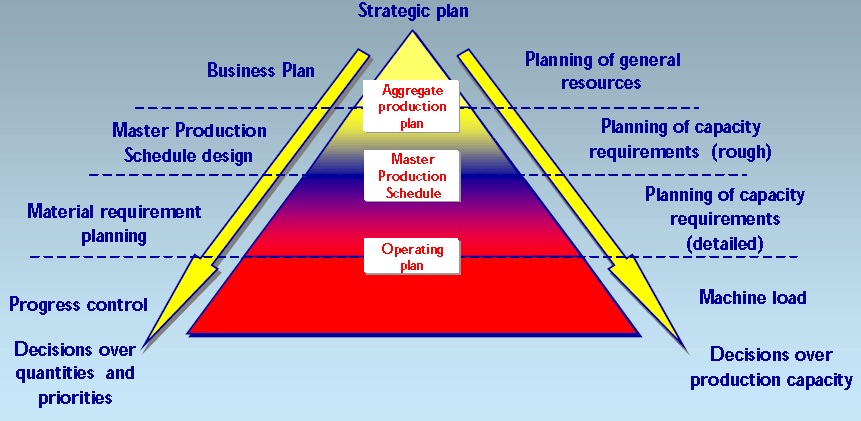
Planning management levels
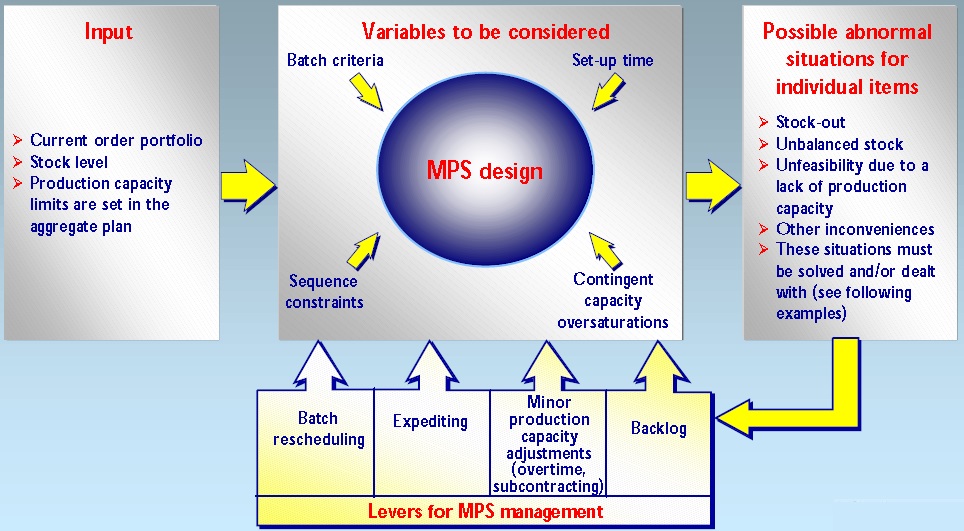
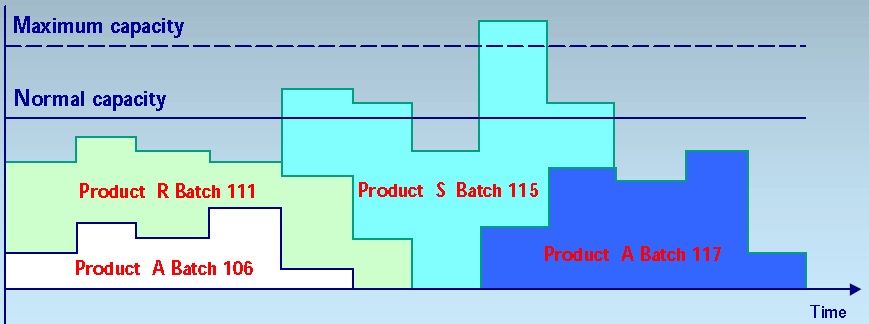
Master prodution schedule design-Variables to be considered
2.2MRP(material requirement plan)
Requires 100000 POINTS in the General category.2.3CRP & Scheduling(Capacity requirement plan workload per workshop)
Requires 100000 POINTS in the General category.3.1Bottleneck Mgt
Requires 100000 POINTS in the General category.3.2Inventories Reduction
Requires 100000 POINTS in the General category.3.2.1 Step1 Inventory Reduction-understand current situation
Requires 100000 POINTS in the General category.3.2.2 Step2 Inventory Reduction-Restore to basic condition for good inventory
Requires 100000 POINTS in the General category.3.2.2.1 Safety stock
 Safety Stock
First of all, here's the formula so you don't have to dig through my well-written article for it.
Safety Stock: {Z*SQRT(Avg. Lead Time*Standard Deviation of Demand^2 + Avg. Demand^2*Standard Deviation of Lead Time^2}
If that wasn't clear to you, I suggest reading on. This article will explain in detail what safety is used for, and how to use it.
Inventory management is about two things: not running out, and not having too much. Our desire to not run out, along with uncertainties in demand and supplier lead times are why we have inventory in the first place. Essentially, inventory is a reserve system to prevent a stock out. However, as important as it is to prevent such a stock out, we also don’t want to hold onto too much inventory because of holding costs. So how do you balance the two and what is the right amount? More importantly, when should you re-order in order to prevent a stock out? The answer to this can be determined by obtaining and applying the following information about the inventory you wish to manage.
Re-order Point (ROP)
1. What is the average lead time for the part/finished good that you need?
2. What is the standard deviation of that lead time? It is very important to track how long shipments take from you suppliers. If you are not doing this, start. It should be your top priority. Assuming you have tracked the data, excel can very easily help you determine your standard deviation. In excel, go to the toolbar and click on Insert, then click on Function, and choose STDEV and click ok. Then, enter in as much lead time data you have and presto, you have your standard deviation.
3. What is the expected demand you are working with?
4. What is the standard deviation on this demand? Perhaps this is something you will be familiar with from experience, however, if not, this is something you should be able to squeeze out of Ted from the marketing department. One way to find it is to look at historical demand and use the STDEV function in excel to determine it.
5. How sure do you want to be that you aren’t going to run out? 90%, 95%, 98%, 99%? Whatever you decide, this will become your service level. Using this percentage, a statistical z-table should be used to get the corresponding “z-value.” A good z-value webpage can be found at http://www.inventoryops.com/safety_stock.htm. So, for example, if you want a 98% service level, you would use 2.05 as your z-value.
Ok, so you’ve gathered this data, now here’s what you do with it.
(Underlined section is safety stock)
Re-order point=Average Lead Time*Average Demand + Z*SQRT(Avg. Lead Time*Standard Deviation of Demand^2 + Avg. Demand^2*Standard Deviation of Lead Time^2)
In this formula, the first term (Average Lead Time*Average Demand) is the average demand.
The second term {Z*SQRT(Avg. Lead Time*Standard Deviation of Demand^2 + Avg. Demand^2*Standard Deviation of Lead Time^2} is the term that allows for the safety stock. In other words, the second term is the optimal safety stock level.
It is not simple to gather all the data that is needed for the calculations. For a product with multiple parts, each part needs to have its own re-order point calculations and its own safety stock calculation. This can all become very confusing if proper computer modeling is not employed.
Although I mentioned excel earlier, excel is probably not sufficient for your company’s software needs. If you have not already done so, it is very important to look into an integrated software package for these calculations and many others.